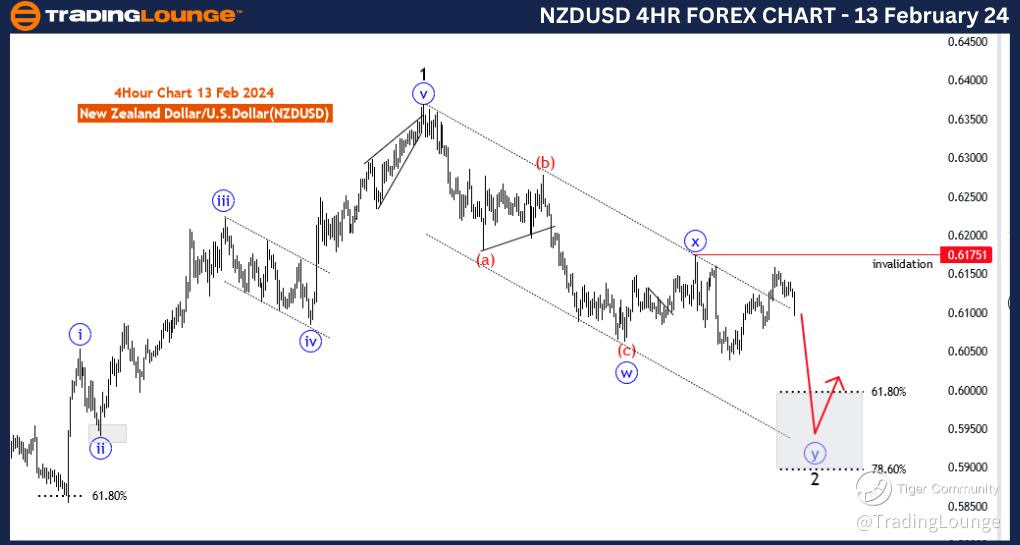
NZDUSD Elliott Wave Analysis: 4-Hour Chart Overview, February 13, 2024
NZDUSD Elliott Wave Technical Analysis
Our latest examination of the New Zealand Dollar/U.S. Dollar (NZDUSD) currency pair on the 4-hour chart employs Elliott Wave principles to provide valuable insights for traders. Here’s what you need to know:
Key Points:
- Function: Counter Trend
- Mode: Corrective
- Structure: Blue Wave Y of 2
- Position: Red Wave 3
- Direction Next Higher Degrees: Black Wave 3
- Details: Blue Wave X of 2 likely completed at 0.61751; Blue Wave Y of 2 in progress, nearing conclusion. Wave Cancel invalid level: 0.61751
In this analysis, we identify a counter-trend movement, suggesting potential reversals against the prevailing trend. Traders may find opportunities within this corrective phase, marked by movements opposing the dominant trend.
The corrective nature of the market structure, as indicated by the "MODE," implies temporary deviations from the primary trend, offering possibilities for strategic trading decisions.
With a focus on the ongoing Elliott Wave pattern, specifically the "blue wave Y of 2" structure, traders gain insights into current market dynamics, aiding in anticipating future price movements.
Detailed wave analysis, such as identifying "Red Wave 3" within the broader blue wave Y structure, is essential for traders utilizing Elliott Wave theory to navigate potential turning points and forecast future price action.
Looking ahead, the analysis points to "black wave 3" as the expected direction of the next higher-degree wave, providing a comprehensive view of the market's potential trajectory.
The completion of "blue wave X of 2" at 0.61751 suggests the end of a corrective pattern, with "blue wave Y of 2" now in play and nearing completion, possibly indicating a resumption of the primary trend.
Traders are advised to closely monitor market movements, particularly the specified invalidation level at 0.61751, as breaching this level may prompt a reassessment of the current wave count and potential shifts in market sentiment.
In summary, the NZDUSD Elliott Wave Analysis for the 4-hour chart on 13 February 24, suggests a counter-trend move with the completion of "blue wave X of 2" and the initiation of "blue wave Y of 2." Traders are advised to monitor the market closely, especially the specified invalidation level at 0.61751, for potential changes in market sentiment.
Technical Analyst: Malik Awais
Source: visit Tradinglounge.com and learn From the Experts Join TradingLounge Here
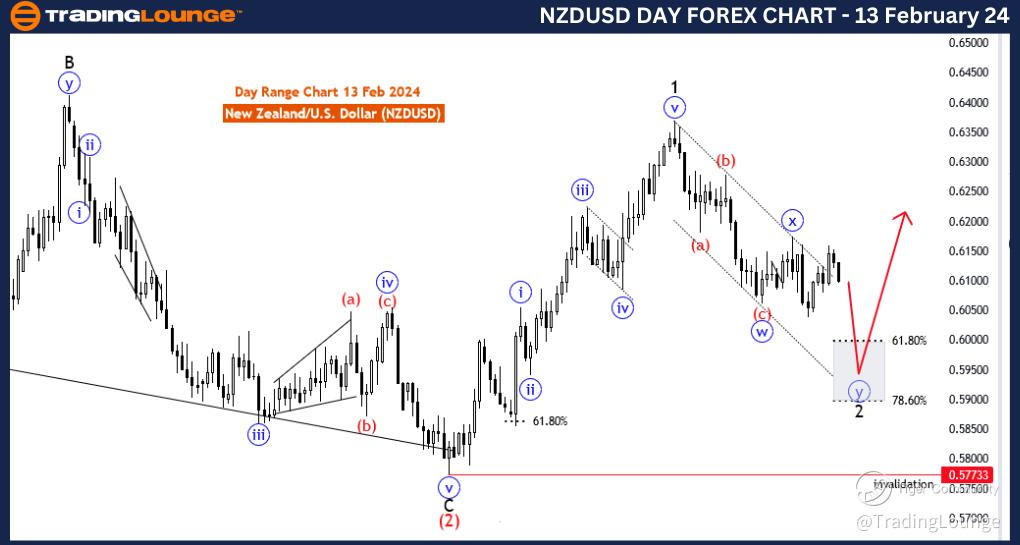
NZDUSD Elliott Wave Analysis: Daily Chart Overview, February 13, 2024
NZDUSD Elliott Wave Technical Analysis
Our in-depth analysis of the NZDUSD currency pair on the daily chart utilizes Elliott Wave principles to offer insights into potential price movements and wave structures, catering to traders with a longer-term perspective. Here's a summary of our findings:
Key Points:
- Function: Counter Trend
- Mode: Corrective
- Structure: Blue Wave Y of 2
- Position: Red Wave 3
- Direction Next Higher Degrees: Black Wave 3
- Details: Blue Wave X of 2 likely completed at 0.61751; Blue Wave Y of 2 in progress, nearing conclusion. Wave Cancel invalid level: 0.57733
This analysis identifies a counter-trend move, indicating potential reversals against the prevailing trend, and providing traders with opportunities to navigate against the primary trend.
The corrective nature of the market structure suggests temporary deviations from the primary trend, offering strategic trading opportunities.
With a focus on the ongoing Elliott Wave pattern, specifically the "blue wave Y of 2" structure, traders gain insights into current market dynamics, aiding in anticipating future price movements.
Detailed wave analysis, such as identifying "Red Wave 3" within the broader blue wave Y structure, is crucial for traders utilizing Elliott Wave theory to navigate potential turning points and forecast future price action.
Looking ahead, the analysis points to "black wave 3" as the expected direction of the next higher-degree wave, providing a comprehensive view of the market's potential trajectory.
The completion of "blue wave X of 2" at 0.61751 suggests the end of a corrective pattern, with "blue wave Y of 2" now in play and nearing completion, potentially indicating a resumption of the primary trend.
Traders are advised to closely monitor market movements, especially the specified invalidation level at 0.57733, as breaching this level may prompt a reassessment of the current wave count and potential shifts in market sentiment.
In summary, the NZDUSD Elliott Wave Analysis for the daily chart on 13 February 24, suggests a counter-trend move with the completion of "blue wave X of 2" and the initiation of "blue wave Y of 2." Traders are advised to monitor the market closely, especially the specified invalidation level at 0.57733, for potential changes in market sentiment.
Technical Analyst: Malik Awais
Source: visit Tradinglounge.com and learn From the Experts Join TradingLounge Here
See Previous: U.S.Dollar/Japanese Yen (USDJPY)