TradingLounge Commodity Corn Elliott Wave Technical Analysis

Function: Trend

Mode: Trend

Structure: Expected Impulse Wave for (3)

Position: Wave 4 of (3)

Direction: Wave 5 of (3)

Details: Wave 4 is nearing completion. Wave 5 down is anticipated to finalize wave (3).

Corn Elliott Wave Technical Analysis

Corn's current price movement signals a continuation of the bearish trend that started in April 2022. The market is trading near the lows seen in October 2020, indicating that this decline is part of a larger bearish cycle originating from April 2022. In this scenario, selling on price rebounds could be a sound strategy.

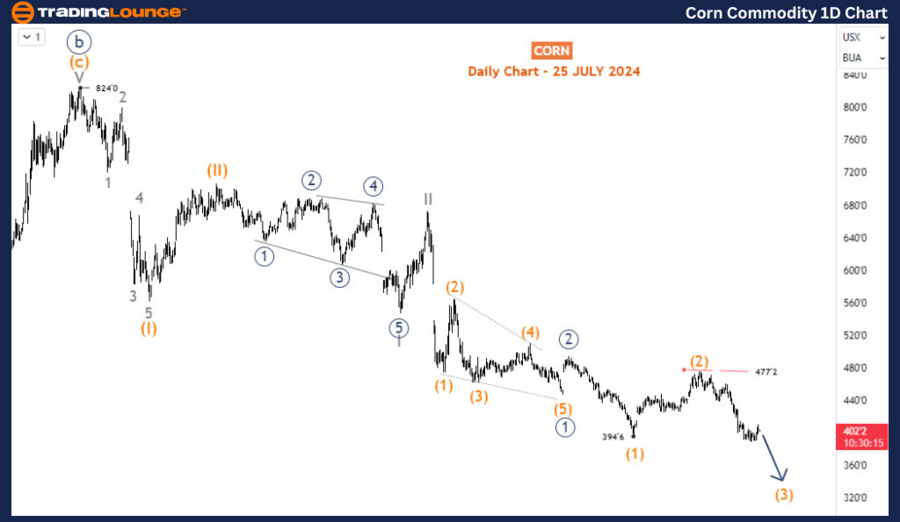
Daily Chart Analysis

On the daily chart, Corn displays a distinct bearish impulse wave pattern that began at the April 2022 peak of 824. The initial two waves, (I) and (II), concluded in July 2022 and October 2022, respectively. Currently, wave (III) is unfolding from the October 2022 high. Within this phase, wave (2) of 3 (circled) of III has ended, suggesting further downside potential. Wave (3) started at 477'2 and is evolving into a bearish impulse wave. Fibonacci projections indicate that this wave could descend to 345 or lower.
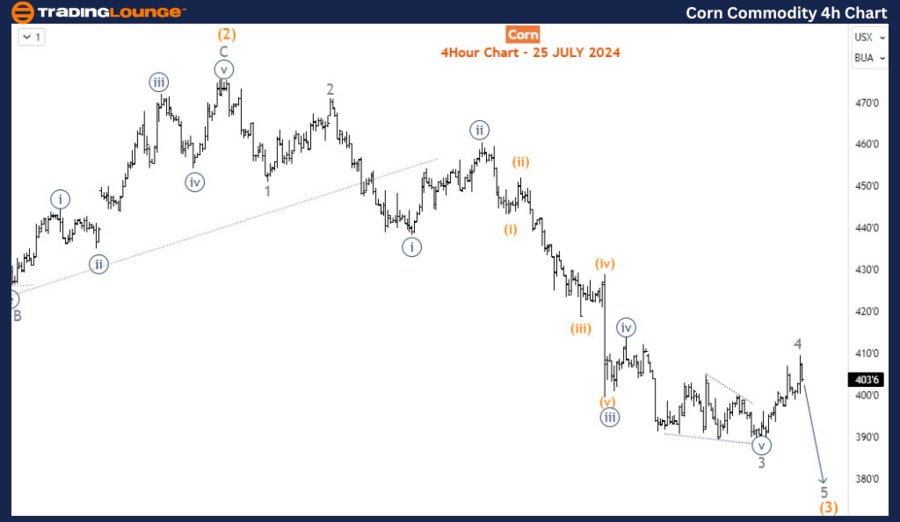
Corn-Commodity-1D-Ch...

H4 Chart Analysis

The H4 chart closely examines the sub-waves within wave (3). Corn has completed an extended move for wave 3 of (3). The current rebound represents wave 4, which has already touched the 23.6% retracement level of wave 3 at 409 and might continue up to the 38.2% retracement level at 420. Once this corrective phase concludes, the commodity is expected to resume its downward trajectory in wave 5 of (3).

Summary

In conclusion, the Elliott Wave analysis for Corn points to a bearish outlook both in the long and short term. Critical levels to monitor include support at 345 and resistance at 420. The analysis indicates that wave (III) is still developing, with wave 3 of (III) likely to push prices further down. Traders should look for selling opportunities during corrective bounces, especially around the 420 level, as the trend remains bearish. By tracking wave structures and key price levels, traders can anticipate future movements in the Corn market and make informed decisions to benefit from the ongoing downtrend.

Technical Analyst: Sanmi Adeagbo

Source: visit Tradinglounge.com and learn From the Experts Join TradingLounge Here 

See Previous: WTI Crude Oil Elliott Wave Technical Analysis

Special Trial Offer - 0.76 Cents a Day for 3 Months! Click here

Access 7 Analysts Over 170 Markets Covered. Chat Room With Support

Corn-Commodity-4hr-C...

Related

Dogecoin Crypto Price prediction News using DOGEUSD Elliott Wave Technical Analysis with Charts Insight

Dogecoin Crypto Price prediction News using DOGEUSD Elliott Wave Technical Analysis with Charts Insight

This analysis provides a detailed Dogecoin price prediction using DOGEUSD Elliott Wave analysis. Lea...

Read More >
NextEra Energy Inc stock's Current Position and Forecasts Future Price Movements using NEE Elliott Wave Technical Analysis

NextEra Energy Inc stock's Current Position and Forecasts Future Price Movements using NEE Elliott Wave Technical Analysis

This article provides an in-depth Elliott Wave analysis of NextEra Energy Inc. (NEE) as of August 20...

Read More >
Swiss Market Index Elliott Wave Technical Analysis: Bullish Orange Wave 3 Insights and Market Projections

Swiss Market Index Elliott Wave Technical Analysis: Bullish Orange Wave 3 Insights and Market Projections

The Swiss Market Index (SMI) is in a bullish impulsive phase as analyzed through Elliott Wave Theory...

Read More >
ASX WESTPAC BANKING CORPORATION Elliott Wave Analysis: WBC Stock Forecast, Trend Insights, Technical Analysis & Market Outlook

ASX WESTPAC BANKING CORPORATION Elliott Wave Analysis: WBC Stock Forecast, Trend Insights, Technical Analysis & Market Outlook

Our ASX WBC Elliott Wave analysis highlights Westpac Banking Corporation’s stock trends and potenti...

Read More >
"Elliott Wave Analysis: NASDAQ 100, SP500, and Top Tech Stocks - Trading Strategies and Market Forecast"

"Elliott Wave Analysis: NASDAQ 100, SP500, and Top Tech Stocks - Trading Strategies and Market Forecast"

This analysis covers the Elliott Wave patterns for NASDAQ 100, SP500, and major tech stocks like App...

Read More >
KOSPI Composite is in a Bullish Trend - KOSPI Elliott Wave Technical Analysis on the Daily and Weekly Charts

KOSPI Composite is in a Bullish Trend - KOSPI Elliott Wave Technical Analysis on the Daily and Weekly Charts

The KOSPI Composite is in a bullish trend, confirmed by Elliott Wave analysis on the daily and weekl...

Read More >

Buy 1 Month

Get 3 Months!

Special Offer:

Trade Recommendations

Unleash the power of deversified trading with our comprehensive portfolio, covering:

  • Stock Trades
  • Crypto Trades
  • Forex Trades
  • Commodity Trades
Elliott Wave Analysis

Gain a competive edge with expert insights in to:

  • Global Indices
  • US Stocks & ASX Stocks
  • Forex & Crypto
  • Commodities
Top-Notch Trading Tools

Equip yourself with the tools of success:

  • Social Chat
  • Elliott Wave Algorithm
  • Screener
  • TradingLevels
  • Trading Game
7 Elliott Wave Analysts

Stay ahead of the market with daily charts and insightful videos
-Your secret to strategic trading!

JOIN HERE


Welcome to TradingLounge (ASIC A.R.No. 321187), specialists in trades, trading education and technical analysis, covering stocks, indices, commodities, forex and cryptocurrencies.

When you join TradingLounge you have access to everything we offer, including trade tools, educational content and a social platform to chat with like-minded investors.

Read more

@Copyright 2024 by tradinglounge.com

Contact Us

Australian no: 02 4787 6020

International no: +61 (2) 47876020

Pay with:

Find us on