Elliott Wave Analysis of ADA/USD: Comprehensive Daily Chart Review
Cardano/USD (ADAUSD) Elliott Wave Technical Analysis
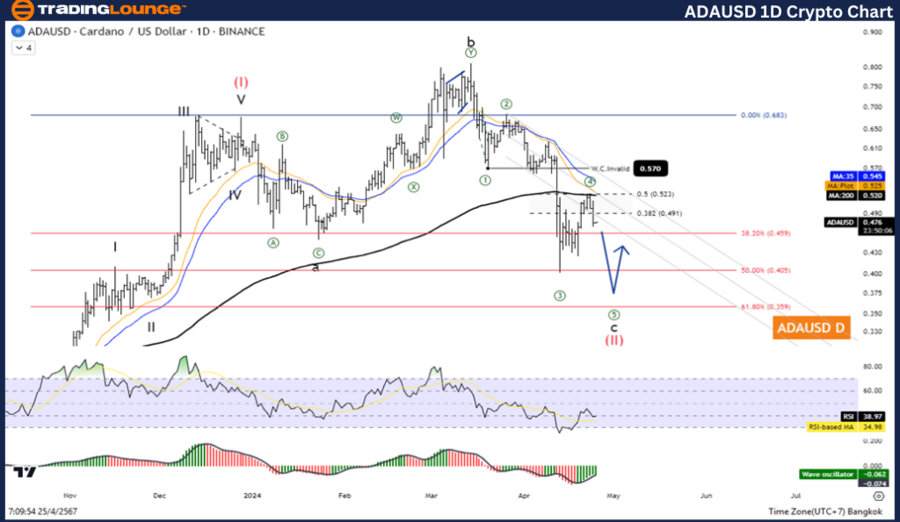
- Type of Movement: Counter Trend
- Nature: Corrective
- Pattern: Flat
- Current Position: Wave C
- Future Direction: The next higher degree indicates wave (II) of an Impulse sequence
- Critical Level for Wave Theory Invalidity: Not specified
Detailed Insights: The ongoing Wave II is critical, retracing 61.8% of Wave I, marked at 0.358, suggesting a potential pivot in Cardano’s price action.
Strategic Approach to Trading ADA/USD Based on Elliott Wave Principles
While navigating the second wave correction in the Expanded Flat pattern, ADA/USD is experiencing a downturn within Wave C, expected to unfold over five extended internal sub-waves. Traders should anticipate one more decline to complete Wave C. It's advisable to wait for this correction phase to finish before re-entering the market in alignment with the broader uptrend.
Cardano/USD Technical Indicators and Market Sentiment
Currently, ADA’s price lingers below the 200-day Moving Average (MA200), signaling a downward trend. Moreover, the Wave Oscillator highlights bearish momentum, reinforcing the cautious stance suggested by the wave analysis.
Elliott Wave Analysis of ADA/USD: In-Depth H4 Chart Examination
Cardano/USD (ADAUSD) Elliott Wave Technical Analysis
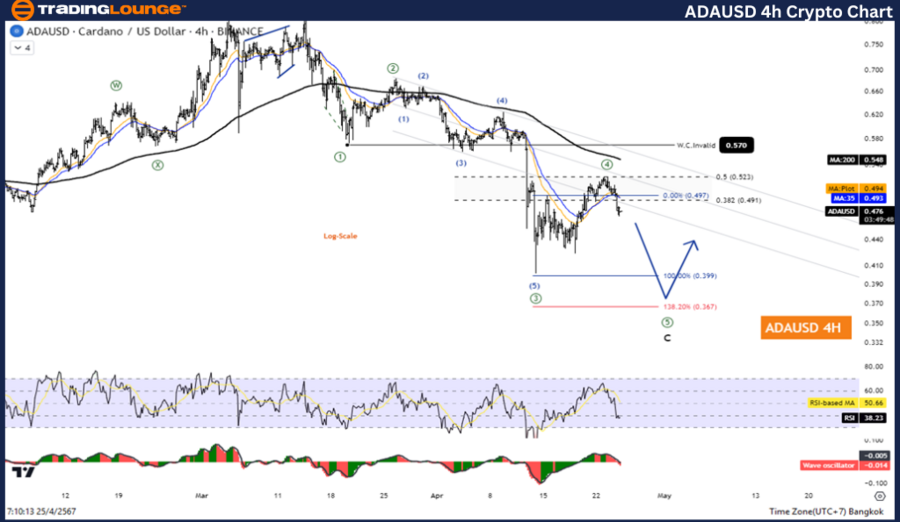
- Type of Movement: Follow Trend
- Nature: Motive
- Pattern: Impulse
- Current Position: Wave 4
- Future Direction: Aims towards wave C of Flat
Critical Level for Wave Theory Invalidity: Not specified
Detailed Insights: A brief pullback in wave 4 is observed, which is anticipated to be followed by a further decline in wave 5, continuing the pattern's progression.
Trading Strategy for ADA/USD Using Elliott Wave Forecast
The corrective pattern noted in the H4 chart, particularly the second wave correction of the Expanded Flat sequence, mirrors the daily chart's observations. With the market mid-way through a decline in Wave C, which features five extended internal sub-waves, there remains a final dip before Wave C concludes. Traders are advised to monitor this phase closely and plan their market re-entry post-correction to capitalize on the forecasted trend continuation.
Technical Indicators and Market Conditions for Cardano/USD
The technical landscape remains consistent with the daily chart analysis. The ADA/USD pair’s position below the MA200 coupled with a bearish momentum as indicated by the Wave Oscillator suggests that the market could still face downward pressures. This supports a cautious trading strategy until the corrective pattern resolves and a clearer bullish signal emerges.
Technical Analyst: Kittiampon Somboonsod
Source: visit Tradinglounge.com and learn From the Experts Join TradingLounge Here
See Previous: Binance/ U.S. dollar(BNBUSD) Elliott Wave Analysis
Special Trial Offer - 0.76 Cents a Day for 3 Months! Click here
Access 6 Analysts covering over 150 Markets. Chat Room With Support
Conclusion and Strategic Trading Tips
In summary, both the daily and H4 Elliott wave analyses of ADA/USD suggest that while the immediate outlook may appear bearish due to the ongoing corrective patterns, strategic patience and careful monitoring of key technical levels could reward traders. The adherence to Elliott wave principles not only helps in identifying potential turning points but also in aligning trading strategies with the inherent market rhythms. Thus, investors should consider waiting for the completion of the current corrective wave before taking positions aligned with the larger impulsive trend anticipated to follow.