Silver Elliott Wave Analysis: 'Buy the Dip' Strategy to Sustain the Rally

Silver (XAGUSD) Daily Chart Analysis:

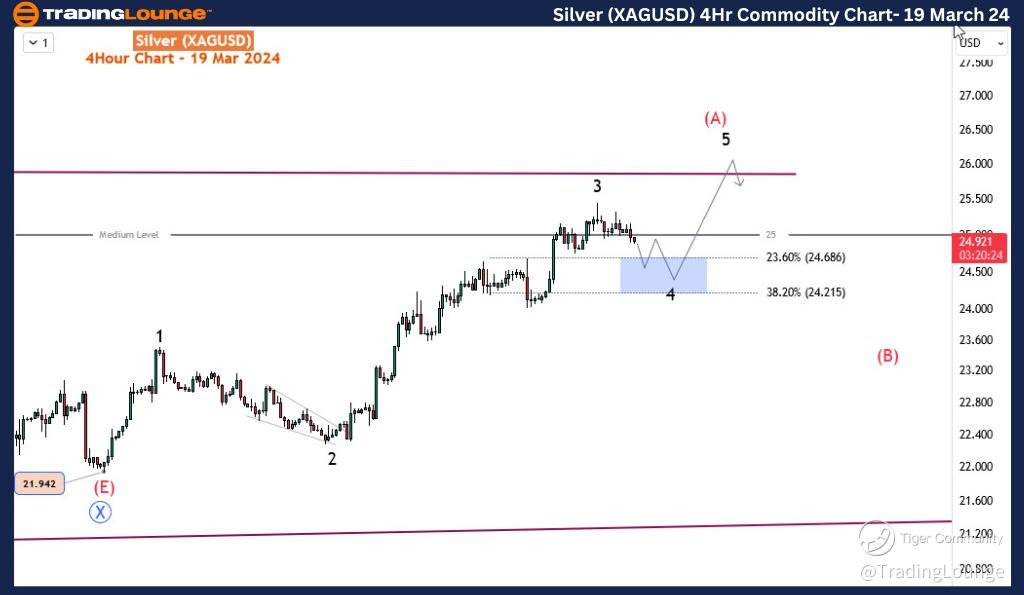
Silver Elliott Wave Technical Analysis

Function - Counter-trend

Mode - Impulse

Structure - Impulse

Position - Wave 3 of (A)

Direction - Wave 4 of (A)

Details - Wave 4 dip is ongoing. Expected to be shallow probably toward 24.5 before resuming higher for wave 5 of (A).

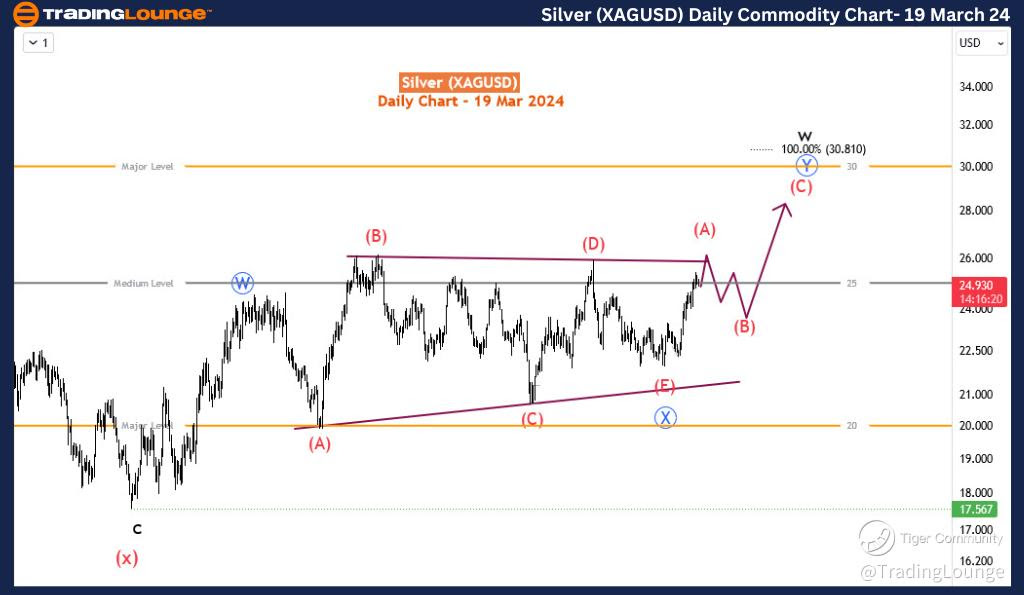
Over a brief period, Silver has witnessed a remarkable surge of over 13%, indicative of a bullish impulse wave rally. This surge signals a potential breakthrough from the one-year range initiated in February 2023. A pivotal point lies ahead as the commodity aims to surpass the $26.5 mark, representing its first significant ascent since March 2022. This marks a key trend reversal in the overarching multi-month trend.

Zooming into shorter time frames, Silver has encountered a dip following its peak in 2024. Despite this temporary setback, market anticipations remain bullish, targeting the psychological threshold of $26. In this Silver Elliott wave analysis, we'll delve into the underlying structures, pivotal levels, and anticipated outcomes.

Analyzing the daily timeframe, Silver's price action reveals a corrective rally initiated at 16.56 in September 2022. A discernible double zigzag pattern suggests further upside potential, extending towards the $30-30.18 range in the medium term. Wave W concluded with a zigzag, succeeded by X showcasing a triangle pattern. Emerging from wave (E) of X, wave Y is ascending higher, likely subdividing into three waves (A)-(B)-(C). Wave (A) is nearing completion around the $25 mark. For swing traders, a strategic approach would involve buying into the anticipated dip after wave (B). It's worth noting that wave (A) may witness one final upward leg before the dip materializes, as depicted on the 4-hour chart.

Silver-XAGUSD-Daily-...


Silver Elliott Wave Analysis Trading Lounge 4-Hour Chart

Silver 4-Hour Chart Analysis:

Silver price and Elliott Wave forecast

On the 4-hour chart, wave 3 of (A) is transitioning to a wave 4 pullback, potentially finding support within the Fibonacci retracement zone of 24.686-24.215. Should this zone indeed offer support, followed by a rebound, another rally towards 25.5-26 is foreseeable before a larger pullback for (B) ensues?

In conclusion, Silver's Elliott wave analysis suggests a continuation of the bullish rally, with a shallow dip anticipated before resuming the upward trajectory. Employing a 'buy the dip' strategy could prove advantageous for traders eyeing potential opportunities in the Silver market.

Technical Analyst: Sanmi Adeagbo

Source: visit Tradinglounge.com and learn From the Experts Join TradingLounge Here 

See Previous: Soybean

TradingLounge Once Off SPECIAL DEAL: Here > 1 month Get 3 months.   

Silver-XAGUSD-4Hr-Co...

Related

The Walt Disney Company (DIS) Stock - Elliottwave Technical Analysis

The Walt Disney Company (DIS) Stock - Elliottwave Technical Analysis

This comprehensive analysis provides an expert overview of The Walt Disney Company (DIS) stock, util...

Read More >
Gold (XAUUSD) Commodity Elliott Wave Technical Analysis: Find Out what to Expect From the Next Pullback and How to Navigate

Gold (XAUUSD) Commodity Elliott Wave Technical Analysis: Find Out what to Expect From the Next Pullback and How to Navigate

This analysis dives into Gold's Elliott Wave structure, examining both daily and H4 chart patter...

Read More >
USDCHF Elliott Wave Analysis: Daily and 4-Hour Insights, Corrective Waves, Trading Strategies, Market Trends, and Risk Management

USDCHF Elliott Wave Analysis: Daily and 4-Hour Insights, Corrective Waves, Trading Strategies, Market Trends, and Risk Management

This article provides a comprehensive Elliott Wave analysis for USDCHF, covering daily and 4-hour ch...

Read More >
Ethereum Elliott Wave Analysis: Detailed ETHUSD Price Prediction, Support & Resistance Levels, and Market Trends

Ethereum Elliott Wave Analysis: Detailed ETHUSD Price Prediction, Support & Resistance Levels, and Market Trends

Ethereum Elliott Wave analysis to understand ETH/USD price trends, key support and resistance levels...

Read More >
Alphabet Inc. (GOOGL) Stocks Technical Analysis: Potential Stock Price Movements and Market Trends using Elliott Wave Theory

Alphabet Inc. (GOOGL) Stocks Technical Analysis: Potential Stock Price Movements and Market Trends using Elliott Wave Theory

This article provides a detailed Elliott Wave analysis of Alphabet Inc. (GOOGL), focusing on daily a...

Read More >

Buy 1 Month

Get 3 Months!

Special Offer:

Trade Recommendations

Unleash the power of deversified trading with our comprehensive portfolio, covering:

  • Stock Trades
  • Crypto Trades
  • Forex Trades
  • Commodity Trades
Elliott Wave Analysis

Gain a competive edge with expert insights in to:

  • Global Indices
  • US Stocks & ASX Stocks
  • Forex & Crypto
  • Commodities
Top-Notch Trading Tools

Equip yourself with the tools of success:

  • Social Chat
  • Elliott Wave Algorithm
  • Screener
  • TradingLevels
  • Trading Game
7 Elliott Wave Analysts

Stay ahead of the market with daily charts and insightful videos
-Your secret to strategic trading!

JOIN HERE


Welcome to TradingLounge (ASIC A.R.No. 321187), specialists in trades, trading education and technical analysis, covering stocks, indices, commodities, forex and cryptocurrencies.

When you join TradingLounge you have access to everything we offer, including trade tools, educational content and a social platform to chat with like-minded investors.

Read more

@Copyright 2024 by tradinglounge.com

Contact Us

Australian no: 02 4787 6020

International no: +61 (2) 47876020

Pay with:

Find us on