Copper Elliott Wave Analysis - buy the dip strategy is ideal

Copper Elliott Wave Technical Analysis

Function - Counter-trend

Mode - Corrective

Structure - Zigzag

Position -Blue wave a of black wave Y

Direction - Blue waves b-c of black wave Y

Since October 2023, Copper has gained over 8%. Meanwhile, the Elliott wave perspective is looking at this commodity to continue the giant corrective structure it started in March 2022. Copper is expected to resume a strong rally once the current minor dip is subdued by the bullish flow again. But the questions are, where can traders and investors look for opportunities and how strong can the rally from October 2023 go into the future? Let’s dive into our commodity Elliott wave analysis that covers Copper.

On the daily time frame chart, from March 2022, when the commodity was trading for nearly $5, we could identify the decline to 3.145 (July 2022 - a 38% decline in just 4 months) as a corrective wave. That fall was wild! However, the bullish response has been corrective and has taken over 1.5 years. As a result, we are forecasting a double zigzag blue wave ‘W-X-Y’ from 5.043 top. Wave W ended at 3.145 and wave X is subdividing into red wave (W)-(X)-(Y). Wave (W) closed at 4.3575 and (X) at 4.52 and (Y) is ongoing. Wave (Y), on its own, seems to be subdividing into black wave W-X-Y. We seemed to have completed wave W and X but Y is in the early stage. Thus, with Elliott wave theory, we have identified the position of the current price in the large scope of the last 2 years' price framework. Let’s head to the H4 chart to see where and how we can find a position.
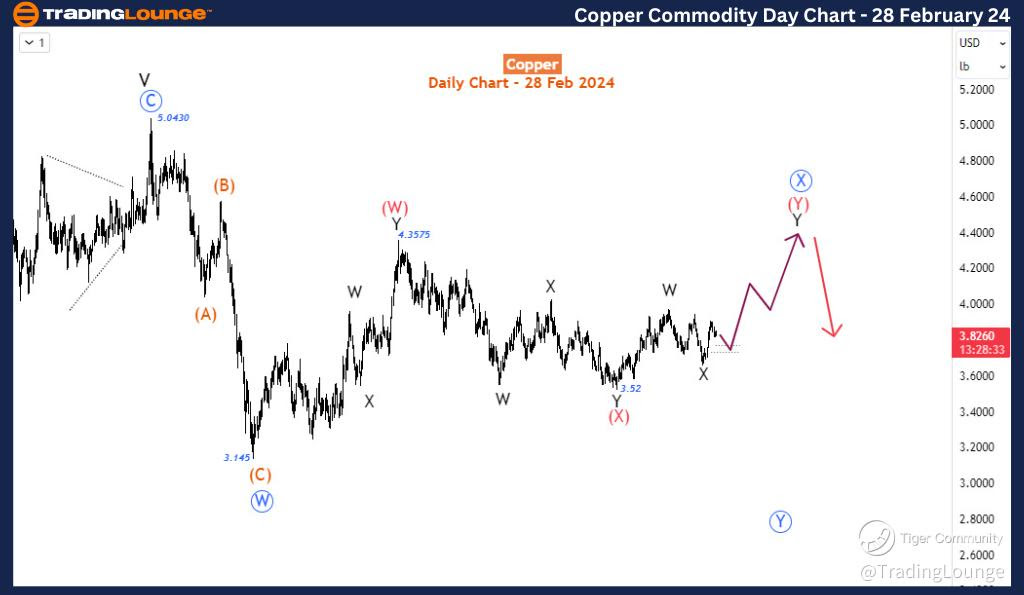
Copper-Day-commodity...


On the H4 time frame chart, after wave X ended, the price advanced in a 5-wave rally. Good response! With the current decline coming out corrective, we will anticipate at least the blue wave  ‘a-b-c’ of Y above the 4.00 medium level. Our focus will now be on how blue wave ‘b’ ends. The further decline for red wave (a)-(b)-(c) of blue b could continue to the 3.72 minor level which is also close to the 70.7% retracement of blue wave ‘a’. The setup will be invalid at 3.65 i.e. price below wave X.

In summary, our forecast supports the recovery of Copper to continue further upside. Therefore the current dip is expected to be corrective and stay above 3.65. Buying interest is expected to surge from there. 

Technical Analyst: Sanmi Adeagbo

Source: visit Tradinglounge.com and learn From the Experts Join TradingLounge Here 

See Previous: Natural Gas (NG)

TradingLounge Once Off SPECIAL DEAL: Here > 1 month Get 3 months.   
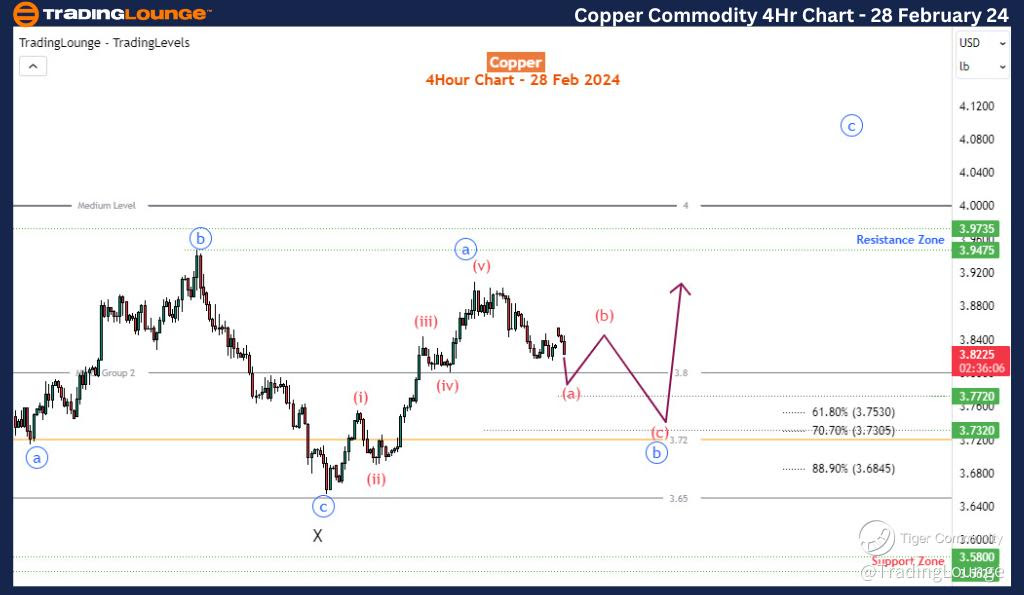
Copper-4h-commodity-...

Related

Shanghai Composite Elliott Wave Analysis Reveals Powerful Bullish Wave 3 Breakout in China’s Stock Market Trend Forecast

Shanghai Composite Elliott Wave Analysis Reveals Powerful Bullish Wave 3 Breakout in China’s Stock Market Trend Forecast

Shanghai Composite enters wave 3 of an Elliott impulsive sequence, suggesting strong bullish momentu...

Read More >
Explore the current Bitcoin Crypto Price trends Today Elliott Wave Technical Analysis to make informed decisions

Explore the current Bitcoin Crypto Price trends Today Elliott Wave Technical Analysis to make informed decisions

In this article, we provide a detailed BTCUSD Elliott Wave analysis focusing on Bitcoin price trends...

Read More >
Bovespa Index Elliott Wave Analysis: Bovespa Stock Picks, and a Technical View on Bullish and Bearish Signals in the Index Market

Bovespa Index Elliott Wave Analysis: Bovespa Stock Picks, and a Technical View on Bullish and Bearish Signals in the Index Market

This in-depth guide on Bovespa Index analysis covers essential trading insights, Elliott Wave interp...

Read More >
Invest in Hang Seng Stocks, Explore the Best Options, and Stay Informed: Hang Seng Index Elliott Wave Technical Analysis

Invest in Hang Seng Stocks, Explore the Best Options, and Stay Informed: Hang Seng Index Elliott Wave Technical Analysis

The Hang Seng Index is a pivotal focus for investors seeking to navigate the complexities of the Hon...

Read More >
Nikkei 225 Elliott Wave Forecast Reveals Japan Stock Market Correction Phase with Impulsive Wave C and Trend Reversal Signals

Nikkei 225 Elliott Wave Forecast Reveals Japan Stock Market Correction Phase with Impulsive Wave C and Trend Reversal Signals

This Elliott Wave analysis of the Nikkei 225 highlights Japan’s market correction phase and forecas...

Read More >
NEOUSD Elliott Wave Analysis: NEO Price Prediction, Breakout Levels, Fibonacci Support, and Market Trends for Crypto Investors

NEOUSD Elliott Wave Analysis: NEO Price Prediction, Breakout Levels, Fibonacci Support, and Market Trends for Crypto Investors

NEOUSD Elliott Wave analysis, covering NEO price predictions, trading strategies, and key resistance...

Read More >

$1 for 2 Weeks

then $29 a month!

What a Special Offer!

Trade Recommendations

Unleash the power of deversified trading with our comprehensive portfolio, covering 250+ markets:

  • Stock Trades
  • Crypto Trades
  • Forex Trades
  • Commodity Trades
Elliott Wave Analysis

Gain a competitive edge with expert insights and AI-powered Elliott Wave charting into:

  • Global Indices
  • US Stocks & ASX Stocks
  • Forex & Crypto
  • Commodities
Top-Notch Trading Tools

Equip yourself with the tools of success:

  • Real-time Chat rooms
  • Elliott Wave Algorithm
  • Portfolio tools
  • TradingLevels
  • Screener
  • Trading Game
7 Elliott Wave Analysts

Stay ahead of the market with daily charts and insightful videos
Your secret to strategic trading!

JOIN HERE


Welcome to TradingLounge (ASIC A.R.No. 321187), specialists in trades, trading education and technical analysis, covering stocks, indices, commodities, forex and cryptocurrencies.

When you join TradingLounge you have access to everything we offer, including trade tools, educational content and a social platform to chat with like-minded investors.

Read more

@Copyright 2024 by tradinglounge.com

Contact Us

Australian no: 02 4787 6020

International no: +61 (2) 47876020

Pay with:

Find us on