Natural Gas Elliott Wave Analysis - ideal ‘sell the bounce’ situation?

Function - Trend

Mode - Impulsive

Structure - Impulse Wave

Position - Black wave 4 of larger degree red wave (3)

Direction - Black wave 4 of higher degree red wave (3) still in play

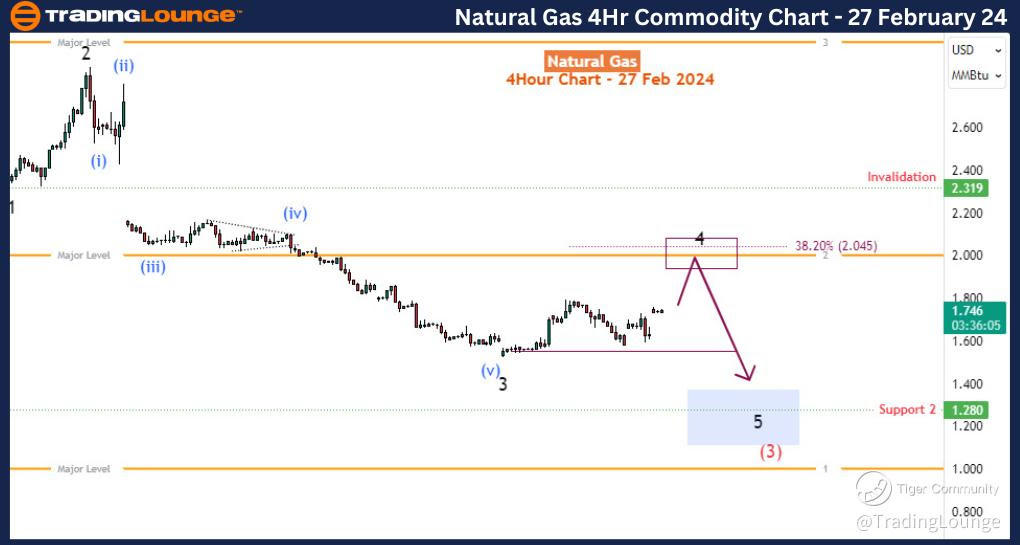
Details: Wave 4 of (3) is still emerging as expected. The black impulse wave structure becomes invalid at 2.319. If the current rally is corrective, we should see further sell-off for wave 5 of (3) toward 1.12. 

Natural Gas (NG) is currently experiencing a notable rebound after a prolonged downtrend that saw a staggering 36% decline since late January. Despite this bounce, the Elliott wave perspective suggests that this upward movement is likely a corrective move preceding another downward leg. Let's delve into the Elliott wave analysis of NG on both the daily and 4-hour time frames.

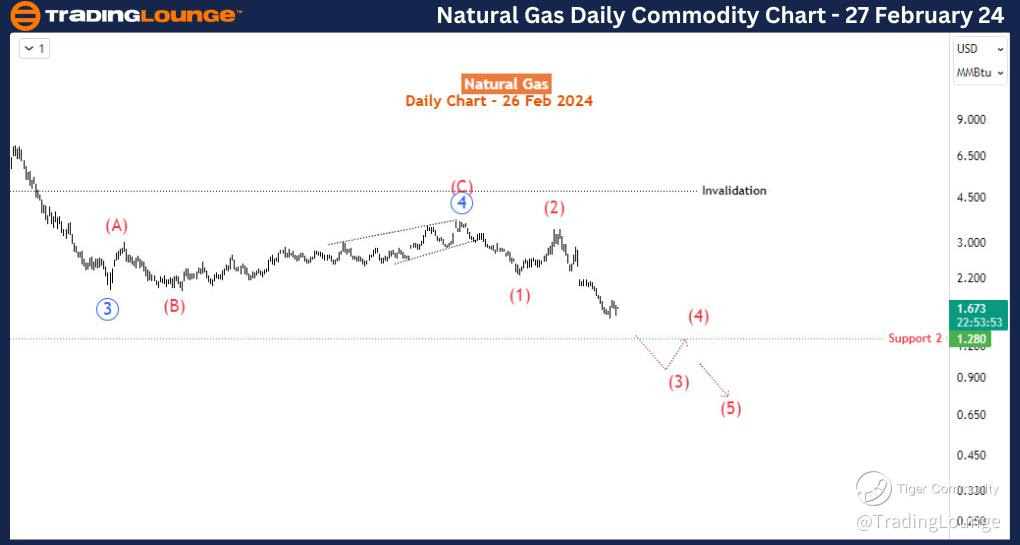
Natural Gas (NG) Daily Chart Analysis

On the daily chart, the bearish trend in NG commenced in late August 2022 when prices hit $10. Since then, NG has been following a clear 5-wave impulse pattern to the downside. The 4th wave (in blue) of this impulse concluded below $3.7 in early November 2023, following an 87% recovery recorded between February and October of the same year. Subsequently, since November, NG has continued its descent, marking a 50% decline as the 5th wave of the impulse unfolds. Currently, the 5th wave (in blue) appears to subdivide into a smaller impulse wave (in red), with Red sub-wave (3) of blue 5 still in progress on the H4 charts. This suggests that the completion of the 3rd leg of the 5th wave is imminent, indicating further bearish price action in the weeks ahead.

Natural-Gas-Commodit...


Natural Gas (NG) 4-Hour Chart Analysis Timeframe

Zooming in on the 4-hour time frame, the ongoing bullish correction is identified as wave 4 of (3), representing the most significant upward movement since late January. Unless there's a breach of the 2.319 level, which would invalidate the developing wave (3) impulse, we anticipate a decline for wave 5 of (3) targeting levels around 1.28 or even the 1.20 major level once wave 4 concludes. The wave 4 correction could rally up to the 2.00 major level, coinciding with the 38.2% Fibonacci retracement level of wave 3.

In summary, the Elliott wave theory supports the expectation of further sell-off for NG. However, it's crucial to confirm that the current minor bounce remains corrective and does not exceed levels around or above 2.00, ensuring it stays below the invalidation level.

Technical Analyst : Sanmi Adeagbo

Source: visit Tradinglounge.com and learn From the Experts Join TradingLounge Here 

See Previous: Soybeans Commodities

Natural-Gas-4H-Commo...

Related

Comprehensive Dogecoin/ U.S. dollar (DOGEUSD) Elliott Wave Analysis: Crypto Trading Strategies and Technical Indicators

Comprehensive Dogecoin/ U.S. dollar (DOGEUSD) Elliott Wave Analysis: Crypto Trading Strategies and Technical Indicators

Delve into an in-depth Elliott Wave Technical analysis of Dogecoin/ U.S. dollar(DOGEUSD), revealing ...

Read More >
Master ASX Trading: BLOCK INC. (SQ2) Elliott Wave Analysis & Technical Forecast | SQ2 Stock Trading Strategy

Master ASX Trading: BLOCK INC. (SQ2) Elliott Wave Analysis & Technical Forecast | SQ2 Stock Trading Strategy

Our detailed Elliott Wave analysis for ASX Block Inc (SQ2) offers actionable insights into wave coun...

Read More >
Fortinet Inc. (FTNT) Elliott Wave Technical Analysis: Stock Forecast, Key Fibonacci Levels, and Technical Insights for Traders

Fortinet Inc. (FTNT) Elliott Wave Technical Analysis: Stock Forecast, Key Fibonacci Levels, and Technical Insights for Traders

Elliott Wave analysis of Fortinet Inc. (FTNT), covering daily and 1-hour charts. It explores the cur...

Read More >
XRP Elliott Wave Analysis: XRPUSD Price Forecast, Ripple Trading Strategy, Daily and H4 Chart Update for Crypto Traders

XRP Elliott Wave Analysis: XRPUSD Price Forecast, Ripple Trading Strategy, Daily and H4 Chart Update for Crypto Traders

Get the latest XRP Elliott Wave analysis for daily and H4 charts, covering XRP price prediction, tra...

Read More >
Larsen & Toubro Elliott Wave Analysis Reveals Bullish Impulse Wave Formation on Daily and Weekly Charts with Key Trading Levels

Larsen & Toubro Elliott Wave Analysis Reveals Bullish Impulse Wave Formation on Daily and Weekly Charts with Key Trading Levels

Larsen & Toubro is forming a bullish Elliott Wave pattern, with impulse waves in development on dail...

Read More >
Navigating the Bullish Cycle: Elliott Wave Analysis and Trading Strategies for NASDAQ Tech Stocks

Navigating the Bullish Cycle: Elliott Wave Analysis and Trading Strategies for NASDAQ Tech Stocks

The NASDAQ 100, SP500, and major tech stocks like Apple, Tesla, Amazon, and others are currently in ...

Read More >

$1 for 2 Weeks

then $29 a month!

What a Special Offer!

Trade Recommendations

Unleash the power of deversified trading with our comprehensive portfolio, covering 250+ markets:

  • Stock Trades
  • Crypto Trades
  • Forex Trades
  • Commodity Trades
Elliott Wave Analysis

Gain a competitive edge with expert insights and AI-powered Elliott Wave charting into:

  • Global Indices
  • US Stocks & ASX Stocks
  • Forex & Crypto
  • Commodities
Top-Notch Trading Tools

Equip yourself with the tools of success:

  • Real-time Chat rooms
  • Elliott Wave Algorithm
  • Portfolio tools
  • TradingLevels
  • Screener
  • Trading Game
7 Elliott Wave Analysts

Stay ahead of the market with daily charts and insightful videos
Your secret to strategic trading!

JOIN HERE


Welcome to TradingLounge (ASIC A.R.No. 321187), specialists in trades, trading education and technical analysis, covering stocks, indices, commodities, forex and cryptocurrencies.

When you join TradingLounge you have access to everything we offer, including trade tools, educational content and a social platform to chat with like-minded investors.

Read more

@Copyright 2024 by tradinglounge.com

Contact Us

Australian no: 02 4787 6020

International no: +61 (2) 47876020

Pay with:

Find us on