26Feb

Bearish trend remains intact Soybeans Commodities charts Elliott Wave Technical Analysis

SoyBean Elliott Wave Analysis - The bearish trend remains intact.

Soybeans continue to exhibit a bearish trend according to Elliott Wave analysis, indicating a sustained downward trajectory. This analysis focuses on identifying trends and patterns within the market to inform trading strategies.

Soybean Elliott Wave Technical Analysis

Trend: Bearish

The current trend in Soybeans is distinctly bearish, characterized by downward price movement over time.

Mode: Impulsive

The market is displaying an impulsive mode, meaning it is prone to swift and decisive price shifts.

Structure: Impulse Wave

The structure of the market's movement aligns with an impulse wave pattern, indicating significant directional momentum.

Position: Black Wave 5 of Higher Degree Red Wave (3)

At present, Soybeans are positioned within black wave 5 of a larger red wave (3), highlighting the stage within the Elliott Wave cycle.

Direction: Ongoing Progression of Black Wave 5 of (3)

The market continues to progress within the framework of black wave 5 of (3), signaling a sustained downward movement.

Technical Analysis Overview

Soybeans' Elliott Wave analysis points towards a continuation of its long-term bearish correction, which commenced in June 2022. Recent price action, particularly the breach of the 1163 swing low, underscores the persistence of downward momentum.

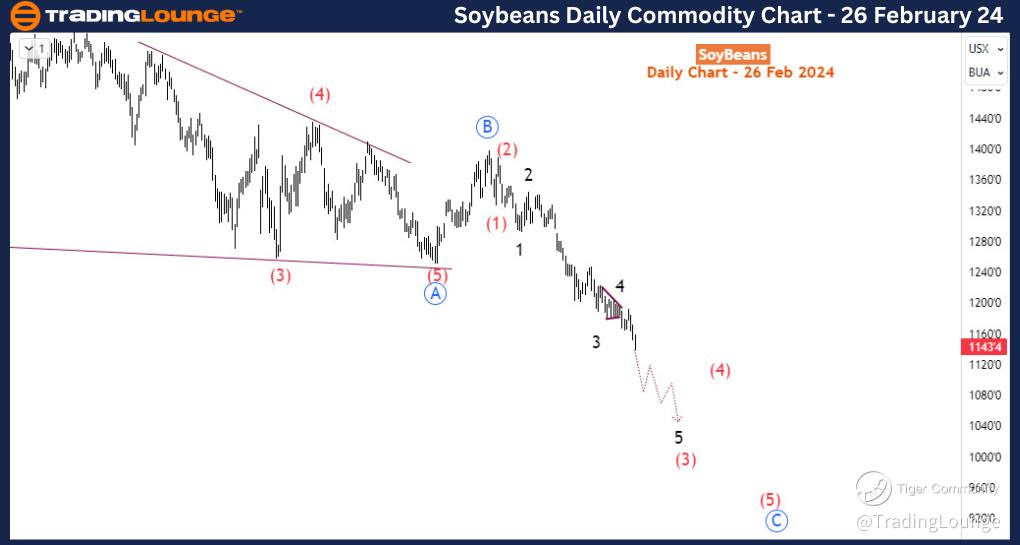
Soybean Daily Chart Analysis

On the daily timeframe, the current downward movement is interpreted as corrective, with the completion of a leading diagonal pattern in blue wave A, followed by a shallow correction in blue wave B, concluding in November 2023. The subsequent breach below 1250 confirmed the continuation of the bearish trend, initiating the bearish impulse wave pattern for blue wave C.

Soybeans-day-commodi...


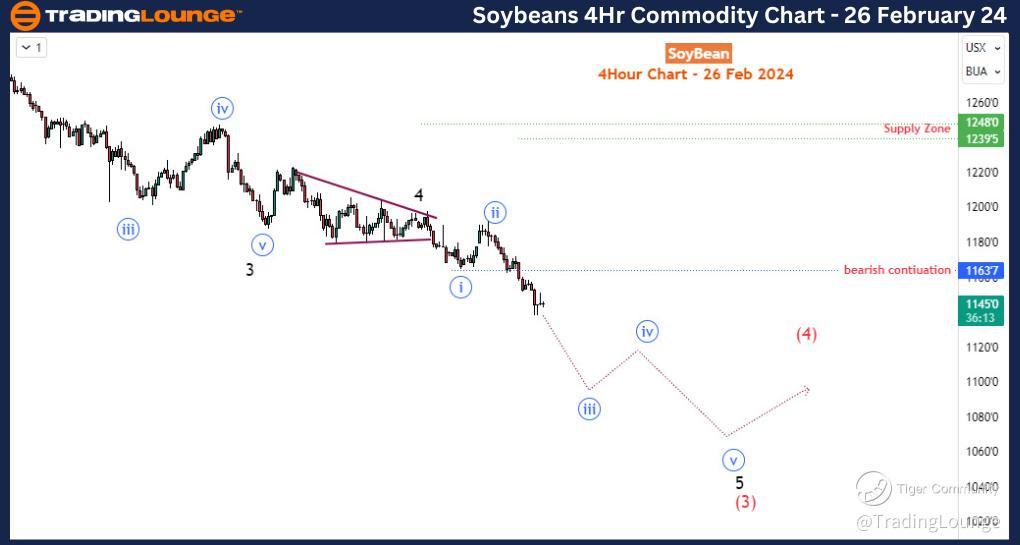
Soybean 4-Hour Chart Analysis Timeframe

A closer examination of the 4-hour timeframe reveals the development of an impulse wave for blue wave C. Presently, the price action indicates the early stages of black wave 5 of red (3) of blue 5. This suggests ongoing bearish momentum, with the potential for further downward movement unless a significant rally occurs above 1197. A decline towards the 1100 level is anticipated for blue wave iii of 5.

Trading Strategy

Given the technical outlook, the recommended trading strategy involves selling into bounces and refraining from buying at lows until there is confirmation of a substantial bullish correction. This cautious approach aligns with the expectation of continued bearish pressure in the near term. Traders are advised to remain vigilant, monitoring price action for indications of a potential shift in market sentiment before considering long positions.

Technical Analyst: Sanmi Adeagbo

Source: visit Tradinglounge.com and learn From the Experts Join TradingLounge Here 

See Previous: Wheat Commodity


Soybeans-4hr-commodi...

Conclusion

In conclusion, the Elliott Wave analysis indicates a bearish outlook for Soybeans, with the likelihood of further downward movement in the short to medium term. Traders should be prepared to navigate the market with a focus on downside potential and remain adaptable to changing conditions.

Related

Computershare (ASX: CPU) Elliott Wave Forecast Highlights Bullish Wave (v) Breakout with Key Price Targets and Support Levels

Computershare (ASX: CPU) Elliott Wave Forecast Highlights Bullish Wave (v) Breakout with Key Price Targets and Support Levels

ASX: CPU may have completed wave (IV) and started wave (V) with bullish potential. See key levels an...

Read More >
NIFTY 50 (INDIA) Index Elliott Wave Technical Analysis: Daily & Weekly Market Trends and Forecasts

NIFTY 50 (INDIA) Index Elliott Wave Technical Analysis: Daily & Weekly Market Trends and Forecasts

This analysis provides a comprehensive view of NIFTY 50 using Elliott Wave theory. Covering both dai...

Read More >
WTI Crudeoil Oil Commodity Elliott Wave Technical Analysis Explores Oil Price predictions, Technical Patterns, and Market Trends

WTI Crudeoil Oil Commodity Elliott Wave Technical Analysis Explores Oil Price predictions, Technical Patterns, and Market Trends

WTI crude oil has reversed lower after completing a bullish correction from September 2024, facing r...

Read More >
PayPal Holdings Inc. (PYPL) Elliott Wave Analysis: Offering Insights into Stock Forecast, Trends & Stock Support and Resistance

PayPal Holdings Inc. (PYPL) Elliott Wave Analysis: Offering Insights into Stock Forecast, Trends & Stock Support and Resistance

This article provides an Elliott Wave analysis of PayPal Holdings Inc. (PYPL), detailing the current...

Read More >
U.S. Dollar /Swiss Franc (USDCHF) Elliott Wave Forecast Shows Bearish Trend Setup with Impulsive Wave Structure and Trading Signals

U.S. Dollar /Swiss Franc (USDCHF) Elliott Wave Forecast Shows Bearish Trend Setup with Impulsive Wave Structure and Trading Signals

Elliott Wave structure in USDCHF across daily and 4-hour charts. Traders are guided on possible wave...

Read More >
Theta token/ U.S. dollar(THETAUSD) Elliott Wave Technical Analysis 12 December 23

Theta token/ U.S. dollar(THETAUSD) Elliott Wave Technical Analysis 12 December 23

TradingLounge Day and 4H Chart of Theta token/ U.S. dollar(THETAUSD) Elliott Wave Technical Analysis...

Read More >

$1 for 2 Weeks

then $29 a month!

What a Special Offer!

Trade Recommendations

Unleash the power of deversified trading with our comprehensive portfolio, covering 250+ markets:

  • Stock Trades
  • Crypto Trades
  • Forex Trades
  • Commodity Trades
Elliott Wave Analysis

Gain a competitive edge with expert insights and AI-powered Elliott Wave charting into:

  • Global Indices
  • US Stocks & ASX Stocks
  • Forex & Crypto
  • Commodities
Top-Notch Trading Tools

Equip yourself with the tools of success:

  • Real-time Chat rooms
  • Elliott Wave Algorithm
  • Portfolio tools
  • TradingLevels
  • Screener
  • Trading Game
7 Elliott Wave Analysts

Stay ahead of the market with daily charts and insightful videos
Your secret to strategic trading!

JOIN HERE


Welcome to TradingLounge (ASIC A.R.No. 321187), specialists in trades, trading education and technical analysis, covering stocks, indices, commodities, forex and cryptocurrencies.

When you join TradingLounge you have access to everything we offer, including trade tools, educational content and a social platform to chat with like-minded investors.

Read more

@Copyright 2024 by tradinglounge.com

Contact Us

Australian no: 02 4787 6020

International no: +61 (2) 47876020

Pay with:

Find us on