HINDUSTAN UNILEVER – HINDUNILVR Elliott Wave Analysis (1D Chart)

HINDUNILVR Elliott Wave Technical Analysis

Function: Larger Degree Trend Higher (Intermediate degree, orange)

Mode: Motive

Structure: Impulse

Position: Minute Wave ((iii)) Navy

Details: Minute Wave ((iii)) Navy is moving higher within Minor Wave 3 Grey of Intermediate Wave (5) Orange, against the key support level of 2425. Currently, a corrective phase is occurring in the form of Minuette Wave (ii) Orange, before the upward trend resumes.

Invalidation Point: 2425

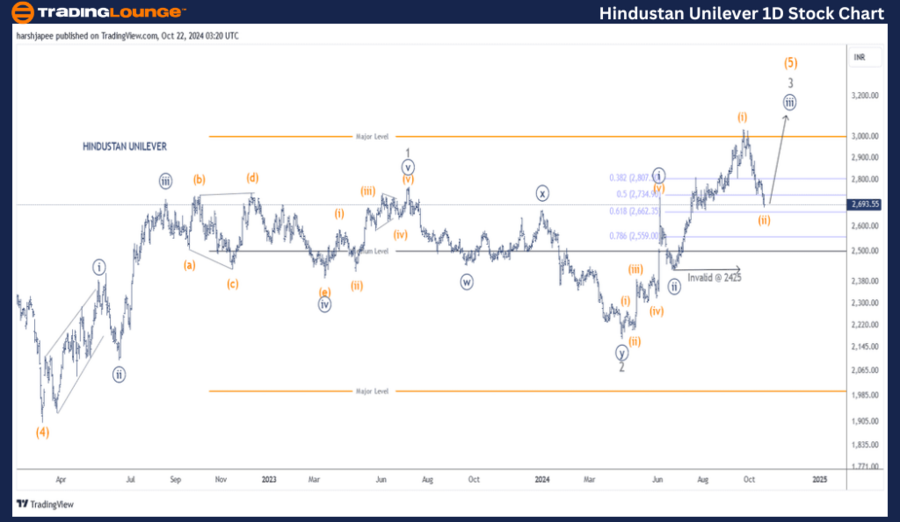
HINDUSTAN UNILEVER Daily Chart Technical Analysis and Elliott Wave Counts

The HINDUSTAN UNILEVER daily chart shows a strong upward trend, progressing within Minor Wave 3 Grey, targeting levels above 2170, which marks the termination of Minor Wave 2. At the time of this analysis, the stock is trading near 2675, with support expected around the 2660 level.

In March 2022, the stock completed Intermediate Wave (4) near 1890. Since then, Minor Waves 1 and 2 have formed near 2770 and 2170, respectively. The stock is now advancing within Minor Wave 3 Grey.

Minute Waves ((i)) and ((ii)) of Minor Wave 3 seem to be complete around the 2733 and 2425 levels. The ongoing Minute Wave ((iii)) is likely to extend, subdividing into five smaller waves in the coming period.

Hindustan-Unilever-1...


HINDUSTAN UNILEVER – HINDUNILVR Elliott Wave Analysis (4H Chart)

Function: Larger Degree Trend Higher (Intermediate degree, orange)

Mode: Motive

Structure: Impulse

Position: Minute Wave ((iii)) Navy

Details: Minute Wave ((iii)) Navy is advancing within Minor Wave 3 Grey of Intermediate Wave (5) Orange, maintaining support above 2425. Currently, a corrective Minuette Wave (ii) Orange is unfolding before the rally in Minute Wave ((iii)) potentially extends.

Invalidation Point: 2425

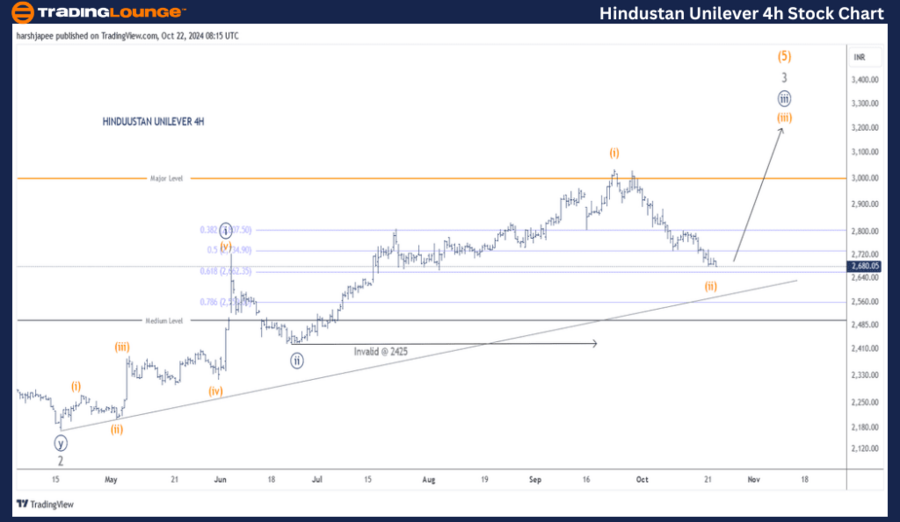
HINDUSTAN UNILEVER 4H Chart Technical Analysis and Elliott Wave Counts

The HINDUSTAN UNILEVER 4H chart illustrates the continuation of the uptrend following the completion of Minor Wave 2 Grey near the 2170 level. Minute Waves ((i)) and ((ii)) seem complete around 2730 and 2425, respectively. With the 2425 level intact, Minute Wave ((iii)) is expected to unfold soon.

Technical Analyst: Harsh Japee

Source: visit Tradinglounge.com and learn From the Experts Join TradingLounge Here 

Previous: ASIAN PAINTS Elliott Wave Technical Analysis

VALUE Offer - Buy 1 Month & Get 3 Months!Click here

Access 7 Analysts Over 200 Markets Covered. Chat Room With Support

Hindustan-Unilever-4...


Conclusion:

HINDUSTAN UNILEVER is currently progressing within Minuette Wave (iii) Orange, part of the larger Minute Wave ((iii)) Navy, and is advancing within Minor Wave 3 Grey of Intermediate Wave (5) Orange. The key invalidation level remains at 2425.

Related

Stocks Bullish Trend: AAPL, AMZN, NVDA, TSLA, GOOGL, META, NFLX, MSFT, Elliott Wave Analysis

Stocks Bullish Trend: AAPL, AMZN, NVDA, TSLA, GOOGL, META, NFLX, MSFT, Elliott Wave Analysis

Explore the latest Commodities Market Technical Analysis, focusing on Bitcoin's potential ascent...

Read More >
VeChain (VET) Elliott Wave Analysis Reveals Key Price Predictions and Strategic Trading Opportunities for Crypto Enthusiasts

VeChain (VET) Elliott Wave Analysis Reveals Key Price Predictions and Strategic Trading Opportunities for Crypto Enthusiasts

This article provides an in-depth Elliott Wave analysis of VeChain (VET), highlighting current marke...

Read More >
S&P/TSX 60 Elliott Wave Chart Reveals Bullish Impulse With Strong Wave 3 Setup and Key Support Holding at 1339

S&P/TSX 60 Elliott Wave Chart Reveals Bullish Impulse With Strong Wave 3 Setup and Key Support Holding at 1339

The S&P/TSX 60 Elliott Wave count shows a bullish structure with wave 3 developing. Canadian stocks ...

Read More >
Overview of ChainLink (LINKUSD) - It Includes Technical Analysis, Price Predictions, and Actionable Trading Strategies

Overview of ChainLink (LINKUSD) - It Includes Technical Analysis, Price Predictions, and Actionable Trading Strategies

This analysis uses Elliott Wave theory to provide a comprehensive overview of ChainLink (LINKUSD). I...

Read More >
Costco Wholesale Corp.(COST:NASDAQ) Elliott Wave Technical Analysis 7 November 23

Costco Wholesale Corp.(COST:NASDAQ) Elliott Wave Technical Analysis 7 November 23

Costco Wholesale Corp.(COST:NASDAQ) Elliott Wave Technical Analysis on 7 November 23, COST Stock Mar...

Read More >
Elliott Wave Analysis: NASDAQ 100 and Major Stocks Including AAPL, TSLA, AMZN Poised for Movements

Elliott Wave Analysis: NASDAQ 100 and Major Stocks Including AAPL, TSLA, AMZN Poised for Movements

This analysis offers an Elliott Wave perspective on the NASDAQ stock market, forecasting upward tren...

Read More >

$1 for 2 Weeks

then $29 a month!

What a Special Offer!

Trade Recommendations

Unleash the power of deversified trading with our comprehensive portfolio, covering 250+ markets:

  • Stock Trades
  • Crypto Trades
  • Forex Trades
  • Commodity Trades
Elliott Wave Analysis

Gain a competitive edge with expert insights and AI-powered Elliott Wave charting into:

  • Global Indices
  • US Stocks & ASX Stocks
  • Forex & Crypto
  • Commodities
Top-Notch Trading Tools

Equip yourself with the tools of success:

  • Real-time Chat rooms
  • Elliott Wave Algorithm
  • Portfolio tools
  • TradingLevels
  • Screener
  • Trading Game
7 Elliott Wave Analysts

Stay ahead of the market with daily charts and insightful videos
Your secret to strategic trading!

JOIN HERE


Welcome to TradingLounge (ASIC A.R.No. 321187), specialists in trades, trading education and technical analysis, covering stocks, indices, commodities, forex and cryptocurrencies.

When you join TradingLounge you have access to everything we offer, including trade tools, educational content and a social platform to chat with like-minded investors.

Read more

@Copyright 2024 by tradinglounge.com

Contact Us

Australian no: 02 4787 6020

International no: +61 (2) 47876020

Pay with:

Find us on