Soybean Elliott Wave Analysis: Understanding Trends and Corrections
Soybean Elliott Wave Technical Analysis:
Function - Trend
Mode - Corrective
Structure - Zigzag
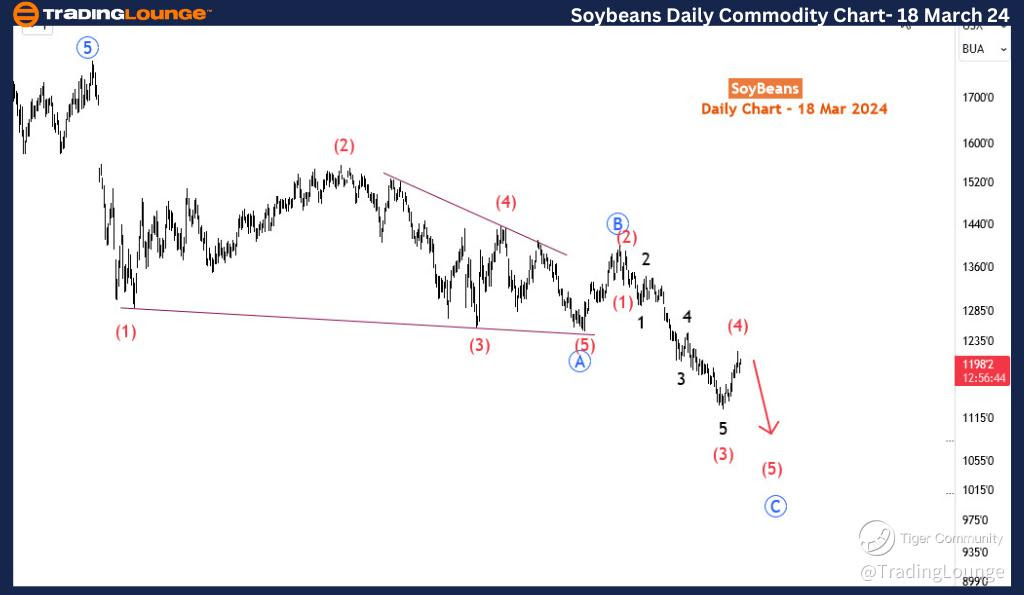
Position - Red wave (4) of blue C
Direction - Downwards for red wave (5) of blue C
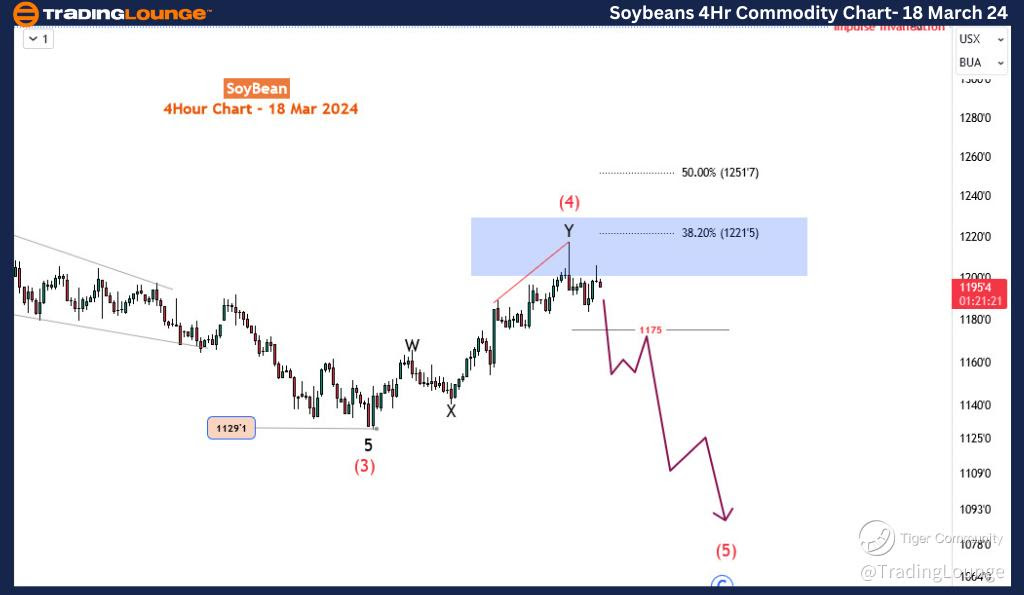
Details - Wave (4) hits a key resistance zone and could be held from further rally toward the 1327 invalidation level. A break below 1160 should be a starter for a further decline toward 1050.
The resurgence of Soybeans since 29th February 2024 is presenting a corrective structure within the broader context of a bearish trend prevailing since 15th November 2023. This corrective move suggests a potential retracement rather than a full-scale reversal of the preceding downtrend. Should this scenario materialize, it's plausible to anticipate a resurgence of selling pressure in the coming days or weeks, potentially leading to a breach of the most recent low and revisiting price levels not seen since October 2020. Employing the Elliott Wave Theory allows for a structural examination, offering insights that can aid in forecasting the future trajectory of this commodity with a heightened level of precision. Delving into the Elliott wave analysis of Soybean across both daily and H4 time frames provides a comprehensive understanding of its current dynamics.
Soybean Daily Chart Analysis
Examining the daily time frame, it becomes apparent that Soybean has been undergoing a prolonged bearish correction since June 2022. Corrections typically manifest in three distinct legs, denoted as A, B, and C. Wave A circled in blue, concluded with a diagonal pattern in October 2023, when Soybean was traded at $1251. Subsequently, wave B unfolded, exhibiting a shallow retracement of just over 23.6% Fibonacci ratio of A, culminating on 15th November 2023 for $1399. Following this, prices descended further as wave C commenced its progression. Notably, wave C is evolving through a five-wave impulse pattern, currently in the process of completing wave (4). Upon the completion of wave (4), wave (5) is expected to perpetuate the downward trajectory, finalizing wave C. The main question at this juncture pertains to whether wave (4) has indeed reached completion, a question that warrants scrutiny of the sub-waves within (4) on the H4 time frame.

Soybean Elliott Wave Analysis Trading Lounge 4 Hour Chart, 18 March 24
Soybean 4-hour Chart Analysis
Transitioning to the H4 time frame, wave (4) is unfolding through a double zigzag pattern marginally beneath the 38.2% Fibonacci retracement level of (3). Early indications such as the emergence of a 'hammer' H4 reversal candlestick pattern and the presence of price-momentum divergence suggest the potential completion of (4). Nevertheless, the prevailing bearish response thus far fails to provide conclusive evidence. A decisive impulsive break below the range of 1175 to 1160 is deemed necessary to fortify the case for (4) having concluded. Should such a breach occur, the probability significantly escalates for wave (5) to extend its downward trajectory, potentially targeting price levels around 1122 or even lower towards 1094.
In conclusion, the Elliott wave analysis of Soybean across both daily and H4 time frames suggests a corrective bounce within the broader context of a protracted bearish corrective phase.
Technical Analyst: Sanmi Adeagbo
Source: visit Tradinglounge.com and learn From the Experts Join TradingLounge Here
See Previous: Crude Oil WTI
TradingLounge Once Off SPECIAL DEAL: Here > 1 month Get 3 months.
