GX URA Elliott Wave Analysis: Unveiling the Uranium Market Opportunity

GX Uranium ETF Commodity Elliott Wave Technical Analysis

The Global X Uranium ETF (GX URA) offers investors broad exposure to the uranium sector, focusing on companies involved in uranium mining, exploration, and production worldwide. With nuclear energy gaining prominence as a cleaner power source, the rising demand for uranium positions the GX URA ETF as a compelling choice for investors seeking to capitalize on the sector's growth potential.

The ETF has maintained a bullish trend since March 2020, consistently making higher highs and higher lows. Its previous peak in May 2024 was surpassed in October following a 10-week corrective pullback from May's high.

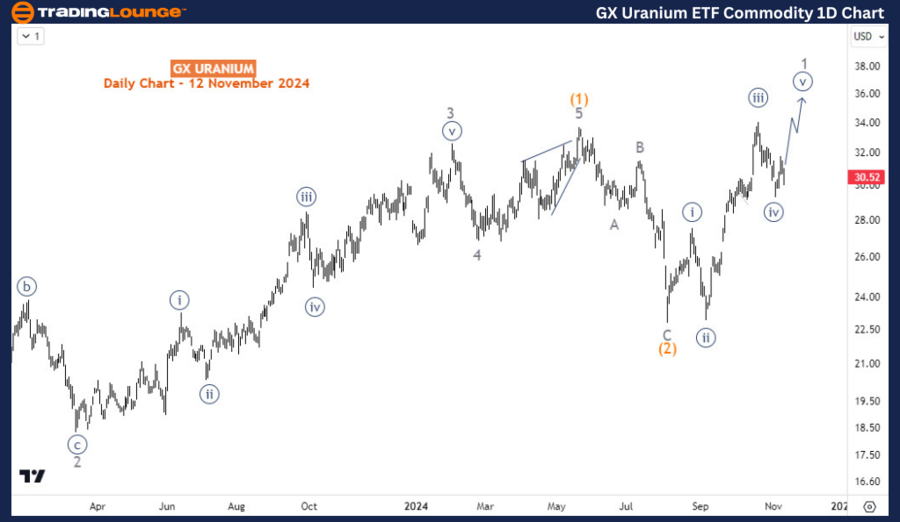
GX Uranium ETF Daily Chart Analysis

After reaching a significant low in November 2021, the ETF formed an impulsive wave A (circled) of the primary degree, marking the initial phase of a larger corrective structure. A corrective pullback for wave B (circled) followed, ending in July 2022. Subsequently, an impulsive wave structure emerged, culminating in May 2024 as wave (1) of C (circled). A pullback formed wave (2), as observed on the daily chart.

Currently, the rally that began on August 5, 2024, appears to be the start of wave 1 of (3), signaling a continuation of the bullish trend. With wave 1 still in progress, the chart suggests significant upside potential remains as the correction plays out.

GX-Uranium-ETF-Commo...


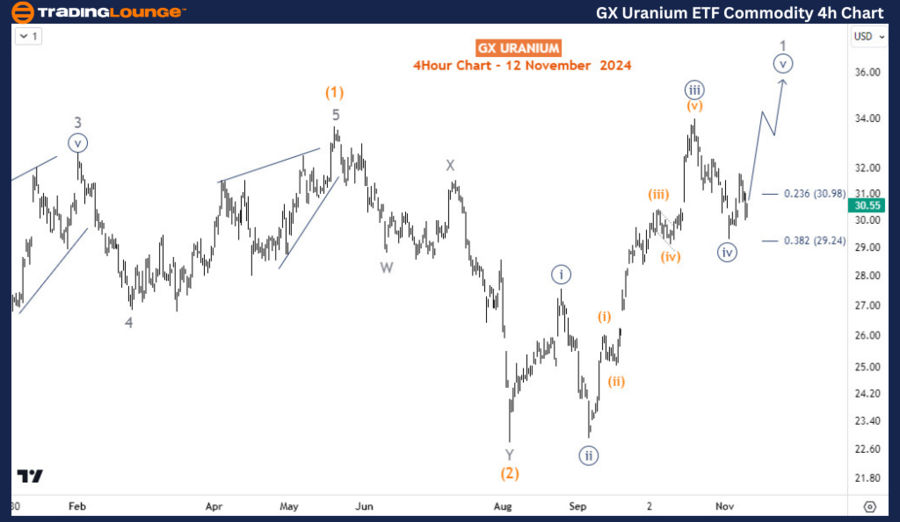
GX Uranium ETF H4 Chart Analysis

The H4 chart reveals that wave 1 of (3) is still developing. The price has completed wave ((iv)) of 1, with further rallies expected in wave ((v)) of 1, potentially targeting $35 before a larger corrective pullback in wave 2.

Key Takeaways:

  • The GX URA ETF continues to exhibit a bullish Elliott Wave structure, pointing to growth opportunities.
  • The rally beginning in August 2024 suggests the start of a new impulsive wave, signaling further potential upside.
  • Near-term price targets indicate potential movement toward $35 before a larger pullback.

By tracking these Elliott Wave patterns, investors can gain deeper insights into the uranium market and the opportunities presented by GX URA.

Technical Analyst: Sanmi Adeagbo

Source: visit Tradinglounge.com and learn From the Experts Join TradingLounge Here 

See Previous: Copper Commodity Elliott Wave Technical Analysis

VALUE Offer - Buy 1 Month & Get 3 Months!Click here

Access 7 Analysts Over 200 Markets Covered. Chat Room With Support

GX-Uranium-ETF-Commo...

Related

In-depth look at the EUR/GBP Currency Pair using the Elliott Wave Theory: Insights into Potential Forex Market Movements

In-depth look at the EUR/GBP Currency Pair using the Elliott Wave Theory: Insights into Potential Forex Market Movements

This analysis provides an in-depth look at the EUR/GBP currency pair using the Elliott Wave theory. ...

Read More >
DOGEUSD Elliott Wave Technical Analysis - Dogecoin’s Potential Uptrend Signals, Trading Strategies, and Market Movements

DOGEUSD Elliott Wave Technical Analysis - Dogecoin’s Potential Uptrend Signals, Trading Strategies, and Market Movements

This article provides an in-depth DOGEUSD Elliott Wave analysis, including Dogecoin’s price forecas...

Read More >
ASX NEM Elliott Wave Forecast Reveals Bullish Newmont Price Targets, Key Invalidation Points, and Uptrend Strategy for Gold Stocks

ASX NEM Elliott Wave Forecast Reveals Bullish Newmont Price Targets, Key Invalidation Points, and Uptrend Strategy for Gold Stocks

This article provides an Elliott Wave-based technical analysis of Newmont Corporation (ASX: NEM), hi...

Read More >
Unveiling Advanced Trading Strategies and Stock Predictions: Analog Devices Inc.(ADI) Stocks Elliott Wave Technical Analysis

Unveiling Advanced Trading Strategies and Stock Predictions: Analog Devices Inc.(ADI) Stocks Elliott Wave Technical Analysis

This article provides a thorough Elliott Wave analysis for Analog Devices Inc. (ADI), offering insig...

Read More >
Johnson & Johnson (JNJ:NYSE) Elliott Wave Technical Analysis 26 January 24

Johnson & Johnson (JNJ:NYSE) Elliott Wave Technical Analysis 26 January 24

Johnson & Johnson (JNJ: NYSE) Elliott Wave Technical Analysis dated 26 January 24, JNJ Stock Market ...

Read More >

$1 for 2 Weeks

then $29 a month!

What a Special Offer!

Trade Recommendations

Unleash the power of deversified trading with our comprehensive portfolio, covering 250+ markets:

  • Stock Trades
  • Crypto Trades
  • Forex Trades
  • Commodity Trades
Elliott Wave Analysis

Gain a competitive edge with expert insights and AI-powered Elliott Wave charting into:

  • Global Indices
  • US Stocks & ASX Stocks
  • Forex & Crypto
  • Commodities
Top-Notch Trading Tools

Equip yourself with the tools of success:

  • Real-time Chat rooms
  • Elliott Wave Algorithm
  • Portfolio tools
  • TradingLevels
  • Screener
  • Trading Game
7 Elliott Wave Analysts

Stay ahead of the market with daily charts and insightful videos
Your secret to strategic trading!

JOIN HERE


Welcome to TradingLounge (ASIC A.R.No. 321187), specialists in trades, trading education and technical analysis, covering stocks, indices, commodities, forex and cryptocurrencies.

When you join TradingLounge you have access to everything we offer, including trade tools, educational content and a social platform to chat with like-minded investors.

Read more

@Copyright 2024 by tradinglounge.com

Contact Us

Australian no: 02 4787 6020

International no: +61 (2) 47876020

Pay with:

Find us on