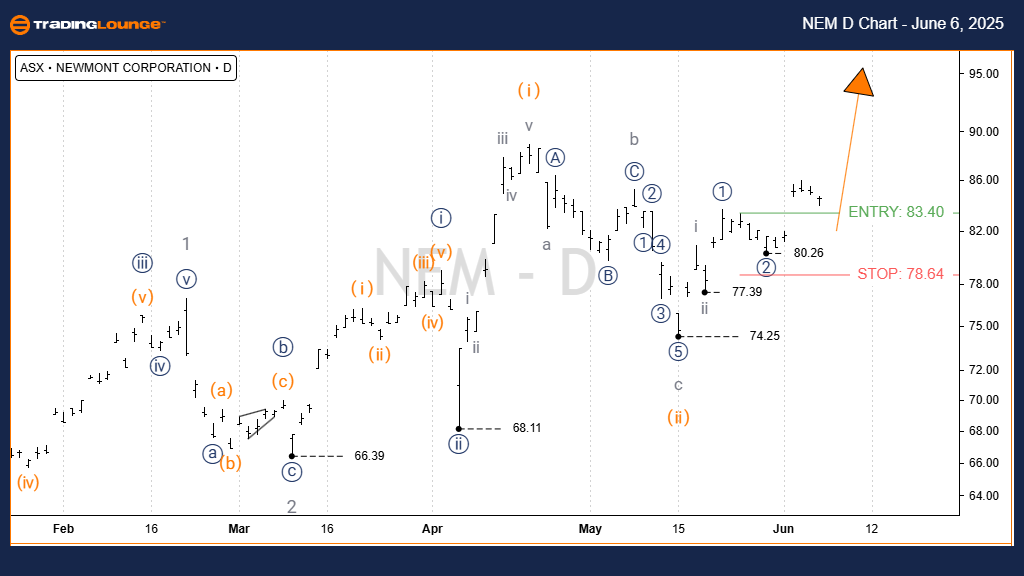
ASX: NEWMONT CORPORATION – NEM Elliott Wave Technical Analysis – TradingLounge (1D Chart)
Overview:
In this Elliott Wave analysis of Newmont Corporation (ASX: NEM), we observe continued bullish momentum on the daily timeframe. The market is currently advancing within Wave iii) – orange, a sub-wave of Wave iii)) – navy, which itself forms part of the broader Wave 3 – grey. This structure aligns with a standard impulsive motive wave. We outline precise bullish targets and key invalidation levels to help traders navigate this trending setup.
ASX: NEWMONT CORPORATION Technical Analysis – 1D Chart (Semilog Scale)
Function: Major Trend (Minor Degree – Grey)
Mode: Motive
Structure: Impulse
Current Position: Wave iii) – orange of Wave iii)) – navy of Wave 3 – grey
Key Insight:
Wave ii) – orange most likely ended as a completed zigzag correction (a, b, c – grey) around the 74.25 low. From this base, Wave iii) – orange has resumed its upward trajectory. A significant resistance level and target zone lies around the 100.00 price mark.
Invalidation Point: 74.25
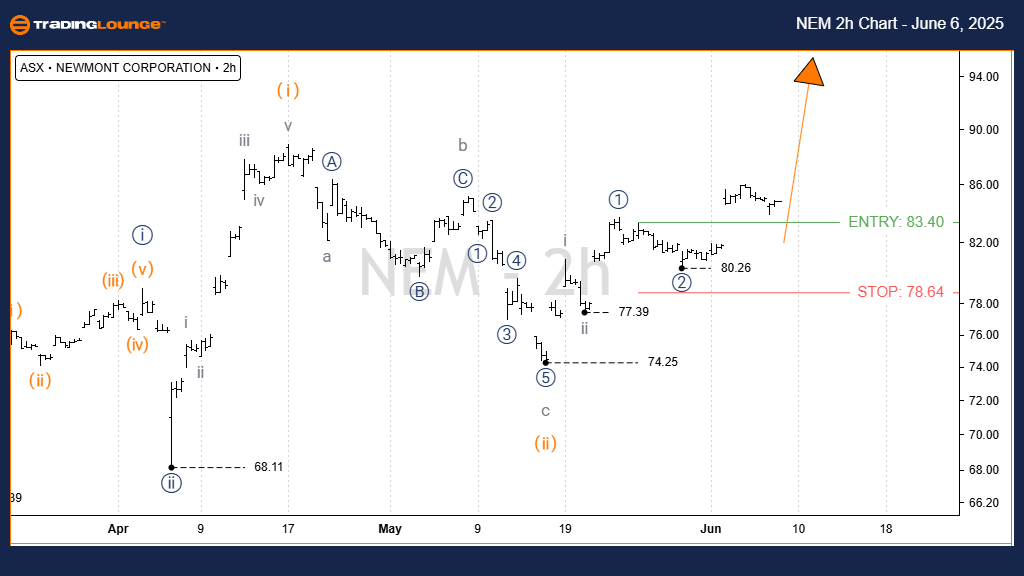
ASX: NEWMONT CORPORATION Elliott Wave Analysis – TradingLounge (4-Hour Chart)
Short-Term Trend Confirmation:
The 4-hour chart supports the bullish continuation scenario outlined in the daily timeframe. The impulsive wave count is consistent across both timeframes, reinforcing our projected price targets.
NEM Technical Analysis – 4-Hour Chart
Function: Major Trend (Minor Degree – Grey)
Mode: Motive
Structure: Impulse
Current Position: Wave iii) – orange of Wave ((iii)) – navy of Wave 3 – grey
Key Insight:
In the shorter timeframe, Wave iii) – orange continues to progress, pushing towards a nearby target around 90.00. The broader target for the entire wave structure remains at 100.00, assuming bullish conditions persist.
Invalidation Point: 74.25
Technical Analyst: Hua (Shane) Cuong, CEWA-M (Master’s Designation).
Source: Visit Tradinglounge.com and learn from the Experts. Join TradingLounge Here
See Previous: CAR GROUP LIMITED Elliott Wave Technical Analysis
VALUE Offer - Buy 1 Month & Get 3 Months!Click here
Access 7 Analysts Over 200 Markets Covered. Chat Room With Support
Conclusion
This dual timeframe Elliott Wave analysis for ASX: NEM highlights both intermediate and near-term bullish scenarios, offering clarity on key resistance and invalidation levels. Traders can utilize these insights for strategic entries and exits in line with the prevailing upward trend.