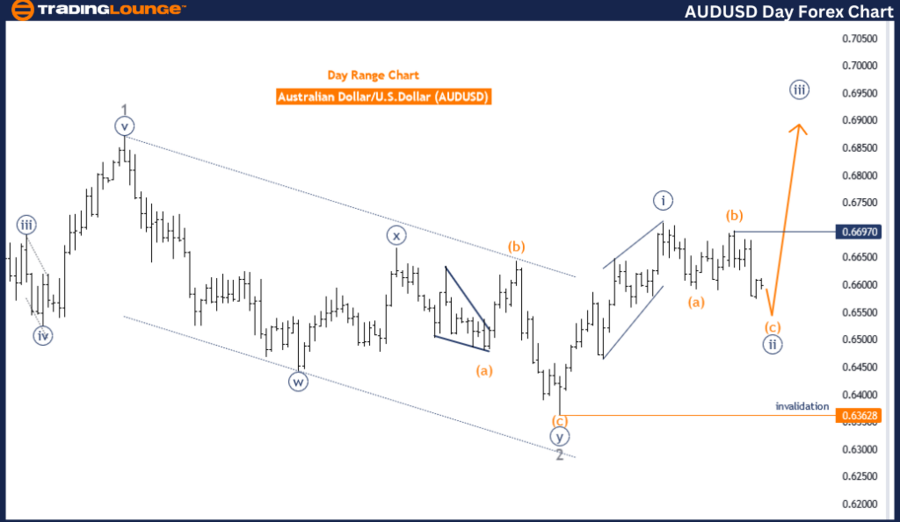
AUDUSD Elliott Wave Analysis Trading Lounge Day Chart
Australian Dollar/U.S.Dollar Day Chart Analysis
AUDUSD Elliott Wave Technical Analysis
FUNCTION: Trend
MODE: Corrective
STRUCTURE: Orange wave C
POSITION: Navy Blue Wave 2
DIRECTION NEXT HIGHER DEGREES: Navy blue wave 3
DETAILS: Orange Wave C of Navy Blue Wave 2 is in play.
Wave Cancel Invalid Level: 0.63628
The AUDUSD Elliott Wave analysis on the day chart examines a trend within a corrective phase. The current wave structure is identified as orange wave C, which is part of the larger navy blue wave 2. This analysis indicates that the market is experiencing a corrective wave before potentially resuming its primary trend direction.
The function of this analysis is to track the trend, with the mode specified as corrective. This means the market is currently undergoing a reversal or consolidation within the larger trend. The specific structure being observed is orange wave C, indicating that the correction is still in progress and has not yet concluded.
In terms of positioning, the analysis places the current market activity within navy blue wave 2. This wave typically represents a retracement or pullback following an initial impulsive wave, in this case, likely navy blue wave 1. The market is expected to complete the corrective phase of orange wave C before transitioning into the next phase, navy blue wave 3, which usually signifies a return to the primary trend direction.
The direction for the next higher degrees is identified as navy blue wave 3, suggesting an anticipated upward movement following the completion of the current corrective wave. This implies that once orange wave C concludes, the market should resume its upward trend, moving into a more impulsive phase.
A critical aspect of this analysis is the wave cancel invalid level, set at 0.63628. This level is essential for maintaining the validity of the current wave count. If the market price drops below this level, it would invalidate the existing wave structure, necessitating a reassessment of the Elliott Wave analysis and potentially altering the expected market direction.
In summary, the AUDUSD day chart analysis shows the market in a corrective phase, specifically within orange wave C of navy blue wave 2. This phase is expected to conclude before the market resumes its primary trend direction with navy blue wave 3. The wave cancel invalid level at 0.63628 is crucial for the validity of the current wave count, guiding traders in anticipating future market movements based on the Elliott Wave principles.
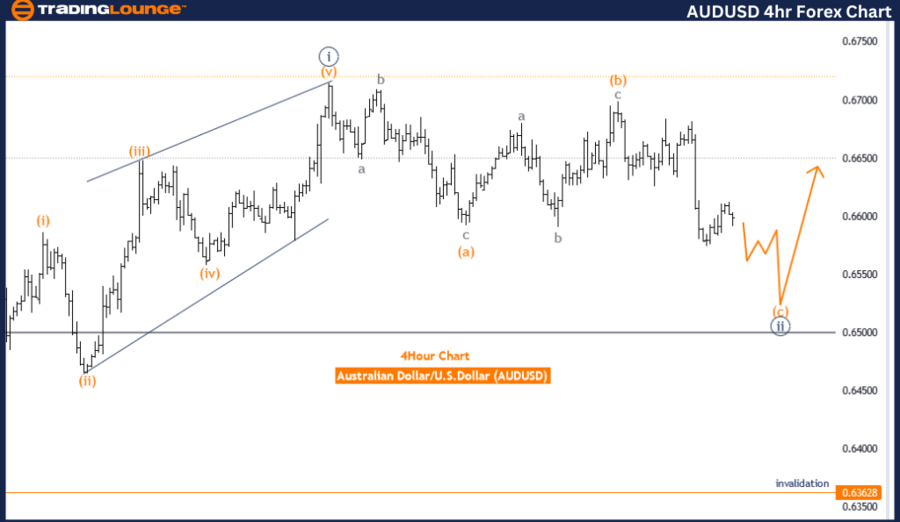
AUDUSD Elliott Wave Analysis Trading Lounge 4-Hour Chart
Australian Dollar/U.S.Dollar 4 Hour Chart Analysis
AUDUSD Elliott Wave Technical Analysis
FUNCTION: Counter Trend
MODE: Corrective
STRUCTURE: Orange wave C
POSITION: Navy blue wave 2
DIRECTION NEXT HIGHER DEGREES: Navy blue wave 3
DETAILS: Orange Wave C of Navy Blue Wave 2 is in play.
Wave Cancel Invalid Level: 0.63628
The AUDUSD Elliott Wave analysis on the 4-hour chart focuses on a counter-trend movement within a corrective phase. The analysis identifies the current wave structure as orange wave C, which is part of the larger navy blue wave 2. This positioning indicates that the market is in the midst of a corrective wave before potentially resuming its primary trend direction.
The primary function of this wave analysis is to understand the counter-trend movement. The mode is corrective, meaning that the market is currently undergoing a temporary reversal or consolidation within the larger trend. The specific structure being observed is orange wave C, suggesting that the correction is still unfolding and has not yet completed.
In terms of positioning, the analysis places the current market activity within navy blue wave 2. This wave typically represents a retracement or pullback after an initial impulsive wave, in this case, potentially navy blue wave 1. The market is expected to complete the corrective phase of orange wave C before transitioning into the next phase, navy blue wave 3, which usually signifies a return to the primary trend direction.
The analysis highlights the direction for the next higher degrees as navy blue wave 3, indicating an anticipated upward movement following the completion of the current corrective wave. This suggests that once orange wave C concludes, the market should resume its upward trend, moving into a more impulsive phase.
A critical aspect of this analysis is the wave cancel invalid level, set at 0.63628. This level is crucial for maintaining the validity of the current wave count. If the market price falls below this level, it would invalidate the existing wave structure, requiring a reassessment of the Elliott Wave analysis and potentially altering the expected market direction.
In summary, the AUDUSD 4-hour chart analysis shows the market in a corrective phase, specifically within orange wave C of navy blue wave 2. This phase is expected to conclude before the market resumes its primary trend direction with navy blue wave 3. The wave cancel invalid level at 0.63628 is vital for the validity of the current wave count, guiding traders in anticipating future market movements based on the Elliott Wave principles.
Technical Analyst: Malik Awais
Source: visit Tradinglounge.com and learn From the Experts Join TradingLounge Here
Previous: New Zealand Dollar/U.S. Dollar Elliott Wave Technical Analysis
Special Trial Offer - 0.76 Cents a Day for 3 Months! Click here
Access 7 Analysts Over 170 Markets Covered. Chat Room With Support