NZDUSD Elliott Wave Analysis | Trading Lounge Daily Chart
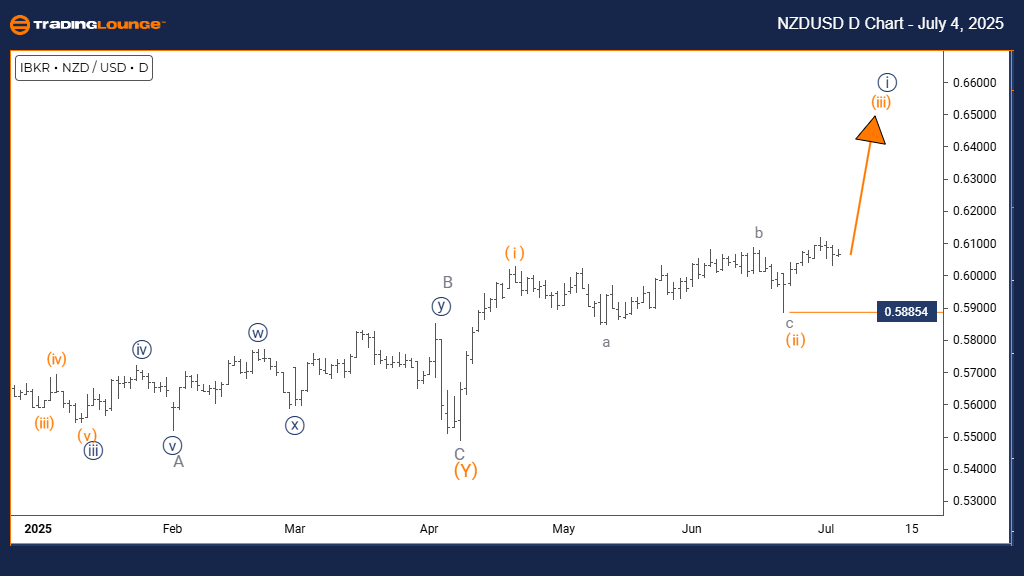
New Zealand Dollar / U.S. Dollar (NZDUSD) – Daily Chart Analysis
NZDUSD Elliott Wave Technical Analysis
FUNCTION: Bullish Trend
MODE: Impulsive
STRUCTURE: Orange Wave 3
POSITION: Navy Blue Wave 1
DIRECTION NEXT HIGHER DEGREES: Orange Wave 3 (active)
DETAILS: Orange Wave 2 has likely completed; Orange Wave 3 now progressing
Wave Invalidation Level: 0.58854
The NZDUSD daily chart indicates a developing bullish trend, consistent with Elliott Wave Theory. The market is currently advancing in an impulsive pattern—orange wave 3—which is part of a larger navy blue wave 1 cycle. This stage usually shows strong upward price momentum with minimal retracements, confirming bullish sentiment.
Since the conclusion of orange wave 2, the price structure has shifted into orange wave 3, a dynamic wave phase known for sharp gains. This upward leg forms a significant component of the ongoing bullish structure within the larger wave count.
Market participants should focus on the critical invalidation level of 0.58854. A breakdown below this point would question the current wave scenario. As long as NZDUSD trades above this threshold, the chart setup favors continued upside movement.
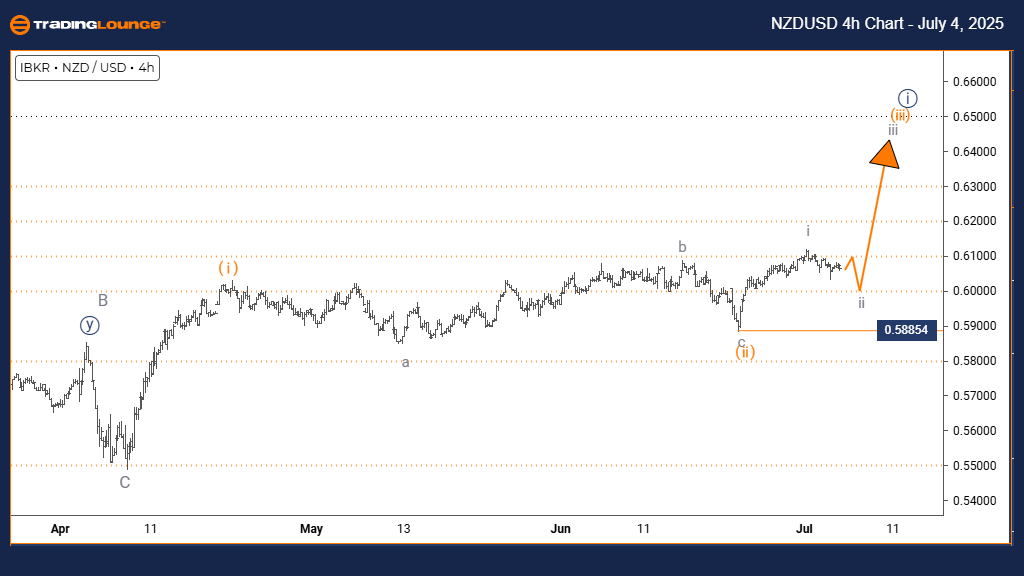
New Zealand Dollar / U.S. Dollar (NZDUSD) – 4H Chart Analysis
New Zealand Dollar / U.S. Dollar Elliott Wave Technical Analysis
FUNCTION: Counter-Trend
MODE: Corrective
STRUCTURE: Gray Wave 2
POSITION: Orange Wave 3
DIRECTION NEXT HIGHER DEGREES: Gray Wave 3
DETAILS: Gray Wave 1 has completed; Gray Wave 2 unfolding
Wave Invalidation Level: 0.58854
On the 4-hour NZDUSD chart, a corrective pattern is developing as gray wave 2 takes shape. This pattern fits within the larger structure of orange wave 3, signaling a short-term pullback amid a broader uptrend.
After the successful formation of gray wave 1, the currency pair is navigating through gray wave 2, often characterized by sideways action or moderate dips. Once this corrective wave concludes, gray wave 3 is expected to resume the dominant bullish trajectory.
Traders should monitor the 0.58854 invalidation level carefully. A break below this point invalidates the current wave interpretation. However, as long as prices stay above, the setup suggests a likely continuation of the overall uptrend.
Technical Analyst: Malik Awais
Source: Visit Tradinglounge.com and learn from the Experts. Join TradingLounge Here
Previous: EURUSD Elliott Wave Technical Analysis
VALUE Offer - $1 for 2 Weeks then $29 a month!Click here
Access 7 Analysts Over 200 Markets Covered. Chat Room With Support