13Feb

NIFTY 50 Elliott Wave Technical Analysis: Expanded Flat Correction Nears 25,000-25,100, Key Support at 22,700

NIFTY 50 INDEX – NIFTY (1D Chart) Elliott Wave Technical Analysis

NIFTY Elliott Wave Technical Analysis

Function: Counter Trend (Minor Degree, Grey)

Mode: Corrective

Structure: Impulse within a larger degree corrective wave

Position: Minute Wave ((ii))

Technical Details:

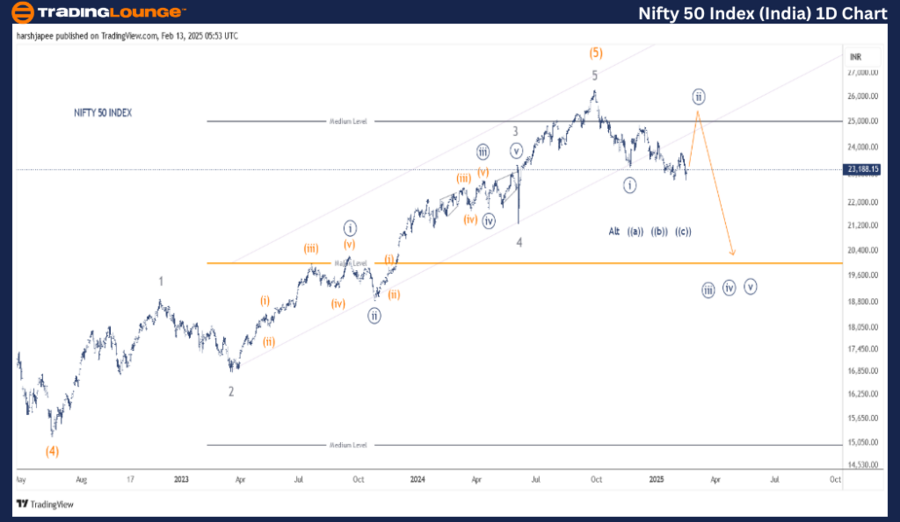
  • Minute Wave ((ii)) appears to be advancing towards the 25,000 level before resuming its downward trajectory.
  • The correction is developing as an expanded flat pattern.
  • Alternatively, the entire structure from the 26,300 peak might be evolving as a correction at Minute degree.

Invalidation Point: 26,400

NIFTY 50 INDEX Daily Chart Technical Analysis and Elliott Wave Outlook

The NIFTY 50 daily chart suggests that a major peak was formed around 26,300 in September 2024. A highly probable Elliott Wave count indicates that the index has completed Minute Wave ((i)) around 23,267 and is currently unfolding a potential expanded flat corrective wave towards the 25,000-25,100 range.

Previously, the index established Intermediate Wave (4) Orange around the 15,200 lows. Following this, a five-wave impulse structure at Minor degree (labeled 1 through 5) drove prices beyond 26,300, marking the termination of Wave (5).

Since then, bears have maintained control, and a deep corrective phase appears to be developing against the 26,300 peak.

NIFTY-50-1d-index-ch...


NIFTY 50 INDEX – NIFTY (4H Chart) Elliott Wave Technical Analysis

Function: Counter Trend (Minor Degree, Grey)

Mode: Corrective

Structure: Impulse within a larger degree

Position: Minute Wave ((ii))

Technical Details:

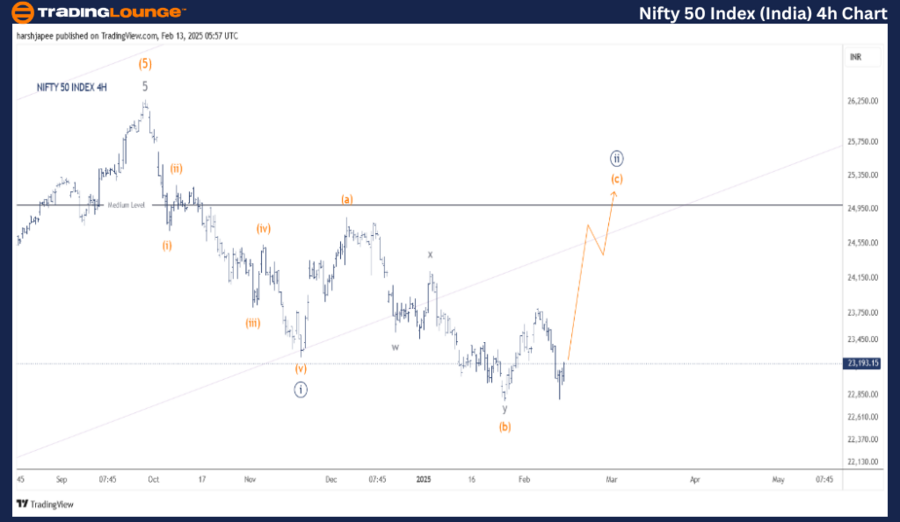
  • Minute Wave ((ii)) seems to be advancing towards 25,000 before the downtrend resumes.
  • The expanded flat correction is labeled as Minuette (a)-(b)-(c) on the 4-hour chart.
  • Alternatively, if the entire structure from the 26,300 high is a correction at Minute degree, it may unfold as a ((a))-((b))-((c)) structure.
  • Under the alternate count, the index may dip below 22,700 before reversing higher.

Invalidation Point: 26,400

NIFTY 50 INDEX 4H Chart Technical Analysis and Potential Elliott Wave Counts

The NIFTY 50 4H chart highlights potential Elliott Wave counts following the formation of the 26,280-26,300 high on September 27, 2024. The initial decline to 23,267 appears to have subdivided into five waves, marking the completion of Minute Wave ((i)).

Following this, the market structure could be evolving as a potential expanded flat correction ((a)-(b)-(c)), with an expected target of 25,000-25,100 in the near term.

  • Wave (a) and Wave (b) appear to have developed around 24,800-24,900 and 22,700-22,800, respectively.
  • If this scenario holds, Wave (c) Orange could be unfolding as a potential impulse wave, retracing against the 22,700-22,800 support range.
  • Alternatively, if the entire structure from 26,300 is a corrective ((a))-((b))-((c)) pattern, this may be part of a larger degree correction.

Technical Analyst: Harsh Japee

Source: visit Tradinglounge.com and learn From the Experts Join TradingLounge Here 

Previous: DAX (Germany) Elliott Wave Technical Analysis

VALUE Offer - Buy 1 Month & Get 3 Months!Click here

Access 7 Analysts Over 200 Markets Covered. Chat Room With Support

NIFTY-50-4h-index-ch...


Conclusion

The NIFTY 50 INDEX is currently advancing towards the 25,000-25,100 zone within Minuette Wave (c) Orange, aiming to complete Minute Wave ((ii)) before the potential downtrend resumes.

Related

NIFTY 50 (India) Index Elliott Wave Technical Analysis: In-Depth Market Trends & Predictions

NIFTY 50 (India) Index Elliott Wave Technical Analysis: In-Depth Market Trends & Predictions

This comprehensive NIFTY 50 analysis utilizes Elliott Wave theory to provide insights into the curre...

Read More >
EURGBP Elliott WaveTechnical Analysis: Bearish Trend, Orange Wave 3 Progression, Risk Management Insights, and Forex Trading Strategies

EURGBP Elliott WaveTechnical Analysis: Bearish Trend, Orange Wave 3 Progression, Risk Management Insights, and Forex Trading Strategies

This comprehensive analysis delves into EURGBP Elliott Wave structures, highlighting the ongoing bea...

Read More >
Bitcoin/U.S. dollar(BTCUSD) Elliott Wave Technical Analysis 25 October 23

Bitcoin/U.S. dollar(BTCUSD) Elliott Wave Technical Analysis 25 October 23

Bitcoin/U.S. dollar(BTCUSD) Elliott Wave Technical Analysis on 25 October 23 with BTCUSD Analysis Da...

Read More >
Visa Inc. (V) Elliott Wave Technical Analysis 1 February 24: Navigating Trends and Corrections for Informed Trading

Visa Inc. (V) Elliott Wave Technical Analysis 1 February 24: Navigating Trends and Corrections for Informed Trading

Discover the latest insights on Visa Inc. (V) through our Elliott Wave Analysis Trading Lounge. Delv...

Read More >
NEE Elliott Wave Analysis: Explore NextEra Energy Stock Trends, Flat Structures, and Bullish Reversal Forecasts

NEE Elliott Wave Analysis: Explore NextEra Energy Stock Trends, Flat Structures, and Bullish Reversal Forecasts

Elliott Wave analysis of NextEra Energy (NEE) examines current stock trends, focusing on wave C corr...

Read More >
Stay Informed on the NEWMONT CORPORATION ASX Stock - NEM Stock Analysis & Elliott Wave Technical Forecast

Stay Informed on the NEWMONT CORPORATION ASX Stock - NEM Stock Analysis & Elliott Wave Technical Forecast

This article provides an in-depth Elliott Wave Analysis of Newmont Corporation (NEM) on the Australi...

Read More >

$1 for 2 Weeks

then $29 a month!

What a Special Offer!

Trade Recommendations

Unleash the power of deversified trading with our comprehensive portfolio, covering 250+ markets:

  • Stock Trades
  • Crypto Trades
  • Forex Trades
  • Commodity Trades
Elliott Wave Analysis

Gain a competitive edge with expert insights and AI-powered Elliott Wave charting into:

  • Global Indices
  • US Stocks & ASX Stocks
  • Forex & Crypto
  • Commodities
Top-Notch Trading Tools

Equip yourself with the tools of success:

  • Real-time Chat rooms
  • Elliott Wave Algorithm
  • Portfolio tools
  • TradingLevels
  • Screener
  • Trading Game
7 Elliott Wave Analysts

Stay ahead of the market with daily charts and insightful videos
Your secret to strategic trading!

JOIN HERE


Welcome to TradingLounge (ASIC A.R.No. 321187), specialists in trades, trading education and technical analysis, covering stocks, indices, commodities, forex and cryptocurrencies.

When you join TradingLounge you have access to everything we offer, including trade tools, educational content and a social platform to chat with like-minded investors.

Read more

@Copyright 2024 by tradinglounge.com

Contact Us

Australian no: 02 4787 6020

International no: +61 (2) 47876020

Pay with:

Find us on