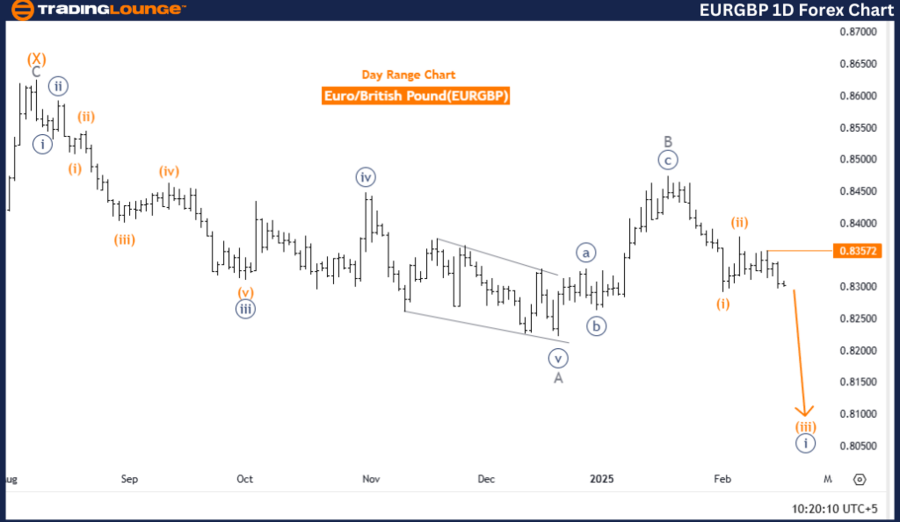
Euro/British Pound (EURGBP) Elliott Wave Analysis – Trading Lounge Daily Chart
EURGBP Elliott Wave Technical Analysis
Function: Bearish Trend
Mode: Impulsive
Structure: Orange Wave 3
Position: Navy Blue Wave 1
Direction (Next Higher Degree): Orange Wave 4
Wave Invalidation Level: 0.83572
Analysis Overview
The EURGBP Elliott Wave Analysis for the daily chart confirms a bearish trend, with strong downward momentum. The market is currently in an impulsive phase, highlighting significant selling pressure.
The wave structure indicates that Orange Wave 3 is forming within a larger Navy Blue Wave 1, reinforcing a strong downside bias.
Wave Structure Breakdown
- Orange Wave 2 (a corrective phase within Navy Blue Wave 1) has completed, leading to the emergence of Orange Wave 3.
- Orange Wave 3 is projected to continue downward, extending the bearish momentum.
- The next higher-degree wave, Orange Wave 4, suggests that after Orange Wave 3 finalizes, a corrective phase may follow.
Key Level to Watch
- Wave Invalidation Level: 0.83572
- If the price surpasses 0.83572, the bearish wave count becomes invalid, potentially signaling a trend reversal.
- Traders should monitor this level closely to confirm the strength and continuation of the downtrend.
Conclusion
- The EURGBP daily chart highlights a strong bearish trend with an impulsive market structure.
- The market remains in Orange Wave 3 within Navy Blue Wave 1, suggesting further downside potential.
- The break of Orange Wave 2 has paved the way for continued selling pressure.
- The invalid level at 0.83572 is a critical reference point for traders assessing potential trend shifts.
- Upon completion of Orange Wave 3, Orange Wave 4 is likely to bring a corrective bounce.
This Elliott Wave forecast provides a structured approach to EURGBP price action, helping traders make informed decisions.
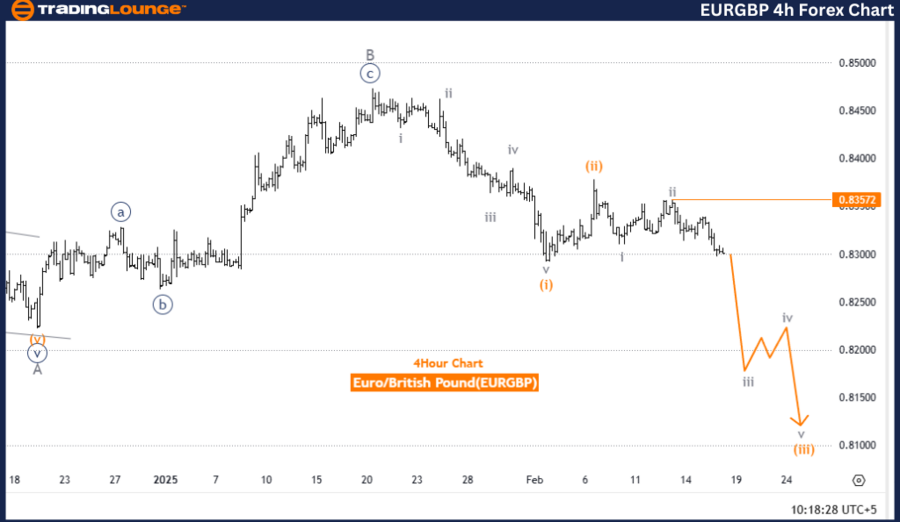
Euro/British Pound (EURGBP) Elliott Wave Analysis – Trading Lounge 4-Hour Chart
EURGBP Elliott Wave Technical Analysis
Function: Bearish Trend
Mode: Impulsive
Structure: Gray Wave 3
Position: Orange Wave 3
Direction (Next Higher Degree): Gray Wave 3 (Developing)
Wave Invalidation Level: 0.83572
Analysis Overview
The EURGBP Elliott Wave Analysis for the 4-hour chart reaffirms the bearish trend, with strong downside movement. The market is in an impulsive phase, further emphasizing selling momentum.
The wave structure confirms that Gray Wave 3 is developing within a larger Orange Wave 3, suggesting a continuation of the bearish cycle.
Wave Structure Breakdown
- Gray Wave 2, a corrective wave within Orange Wave 3, has concluded, leading to the emergence of Gray Wave 3.
- Gray Wave 3 is expected to extend lower, pushing prices downward.
- The next higher-degree wave, Gray Wave 3, signals that selling pressure is likely to persist.
Key Level to Watch
- Wave Invalidation Level: 0.83572
- A price move above 0.83572 will invalidate the current bearish wave count, potentially altering market direction.
- Traders must closely monitor this level to confirm the strength of the downtrend.
Conclusion
- The EURGBP 4-hour chart highlights a firm bearish trend with a strong impulsive wave structure.
- The market remains in Gray Wave 3 of Orange Wave 3, reinforcing further downside potential.
- The completion of Gray Wave 2 has enabled the continuation of bearish momentum.
- The invalid level at 0.83572 serves as a crucial price marker for traders evaluating trend continuation or reversal.
- As Gray Wave 3 progresses, a deeper move lower is anticipated, strengthening the bearish outlook.
This Elliott Wave Analysis offers traders a structured framework for understanding the EURGBP market trend and future price developments.
Technical Analyst: Malik Awais
Source: visit Tradinglounge.com and learn From the Experts Join TradingLounge Here
Previous: NZDUSD Elliott Wave Technical Analysis
VALUE Offer - Buy 1 Month & Get 3 Months!Click here
Access 7 Analysts Over 200 Markets Covered. Chat Room With Support