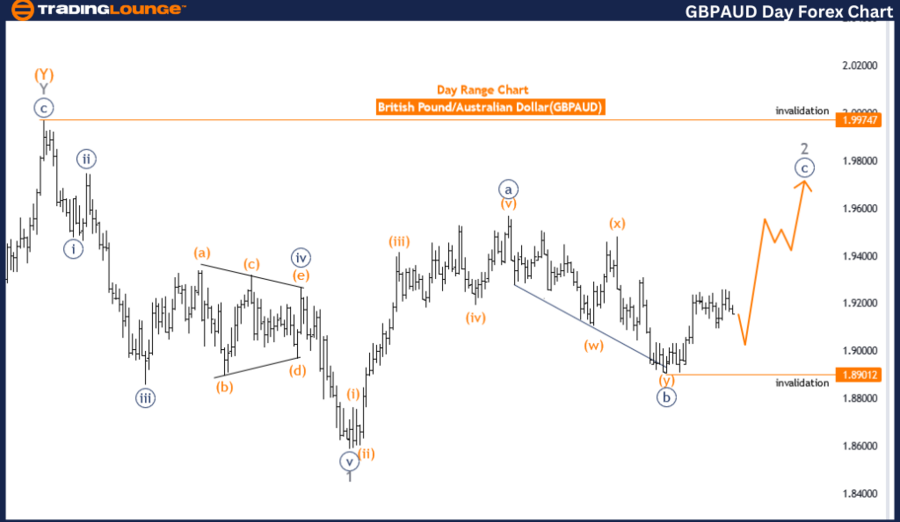
GBPAUD Elliott Wave Analysis Trading Lounge Day Chart
British Pound/ Australian Dollar Day Chart Analysis
GBPAUD Elliott Wave Technical Analysis
Function: Counter Trend
Mode: Impulse as C
Structure: Navy Blue Wave C
Position: Gray Wave 2
Direction Next Lower Degrees: Gray Wave 3
Details: Navy blue wave B of 2 is completed, now navy blue wave C of 2 is in play.
Wave Cancel Invalid Level: 1.89012
The GBPAUD Elliott Wave analysis on the daily chart indicates a counter-trend movement within an impulsive phase identified as navy blue wave C. This suggests a notable impulsive movement within the correction, despite the broader trend being against the primary direction.
The current structure is navy blue wave C, positioned in gray wave 2. This placement suggests that the market is in the early stages of a larger corrective pattern, specifically within the second wave of the gray degree. The direction for the next lower degrees points to gray wave 3, indicating that following the completion of gray wave 2, the market is expected to enter the third wave, typically characterized by strong and impulsive movements.
The analysis details that navy blue wave B of 2 appears to be completed. This phase represents a corrective movement within the larger structure, setting the stage for the subsequent navy blue wave C of 2. The initiation of navy blue wave C of 2 signals a continuation of the overall correction, potentially leading to more pronounced market movements as the wave progresses.
The wave cancel invalid level is set at 1.89012, serving as a critical threshold for validating the current wave structure. If the market price exceeds this level, it would invalidate the expected wave count, requiring a reassessment of the wave structure and potentially altering the analysis.
In summary, the GBPAUD daily chart analysis reveals a counter-trend movement within an impulsive phase of navy blue wave C, currently positioned in gray wave 2. The expected next phase is gray wave 3, which could bring stronger market movements. Traders should watch the completion of navy blue wave C of 2 and prepare for the transition to gray wave 3, while monitoring the wave cancel invalid level at 1.89012. This analysis aids in understanding market dynamics and making informed trading decisions based on Elliott Wave theory.
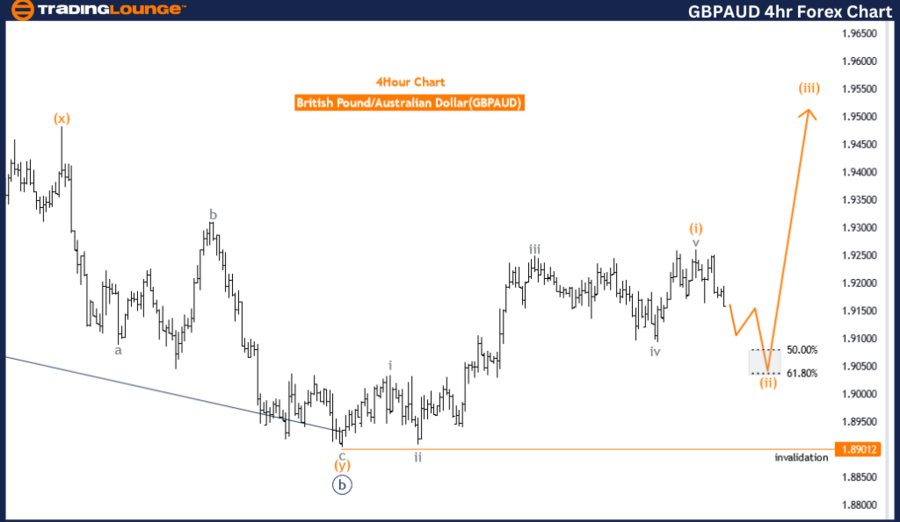
GBPAUD Elliott Wave Analysis Trading Lounge 4-Hour Chart
British Pound/ Australian Dollar 4-Hour Chart Analysis
GBPAUD Elliott Wave Technical Analysis
Function: Counter Trend
Mode: Corrective
Structure: Orange Wave 2
Position: Navy Blue Wave C
Direction Next Higher Degrees: Orange Wave 3
Details: Orange wave 1 of C is completed, now orange wave 2 of C is in play.
Wave Cancel Invalid Level: 1.89012
The GBPAUD Elliott Wave analysis on the 4-hour chart highlights a counter-trend movement within a corrective phase. The primary focus is on the current wave structure, specifically orange wave 2. This indicates that the market is experiencing a correction rather than a strong trend continuation.
The position within this structure is identified as navy blue wave C. This suggests that the market is in the third leg of the corrective phase, which often signifies the final part of a correction before a new trend begins. The direction for the next higher degrees points to orange wave 3, implying that once the current corrective phase concludes, the market is expected to enter an impulsive phase characterized by stronger directional movements.
The analysis details the recent completion of orange wave 1 of C. This phase marks the initial leg of the navy blue wave C corrective structure. Following this, the market has entered orange wave 2 of C, indicating a continuation of the correction. This phase typically involves a retracement or consolidation, setting the stage for the final leg of the correction.
A critical aspect of the analysis is the wave cancel invalid level set at 1.89012. This level serves as a benchmark for validating the current wave structure. If the market price exceeds this level, it would invalidate the expected wave count, necessitating a reevaluation of the wave structure and potentially redefining the analysis.
In summary, the GBPAUD 4-hour chart analysis reveals that the market is in a corrective phase within navy blue wave C, specifically in orange wave 2. The expected next phase is an impulsive orange wave 3, signaling the end of the current correction. Traders should monitor the completion of orange wave 2 and prepare for the potential onset of orange wave 3, while keeping a close watch on the wave cancel invalid level at 1.89012. This analysis aids in predicting market movements and making informed trading decisions based on Elliott Wave principles.
Technical Analyst: Malik Awais
Source: visit Tradinglounge.com and learn From the Experts Join TradingLounge Here
Previous: U.S. Dollar/Swiss Franc (USDCHF) Elliott Wave Technical Analysis
Special Trial Offer - 0.76 Cents a Day for 3 Months! Click here
Access 7 Analysts Over 170 Markets Covered. Chat Room With Support