ASX: ANZ GROUP HOLDINGS LIMITED - ANZ Elliott Wave Technical Analysis TradingLounge (1D Chart)

Greetings,
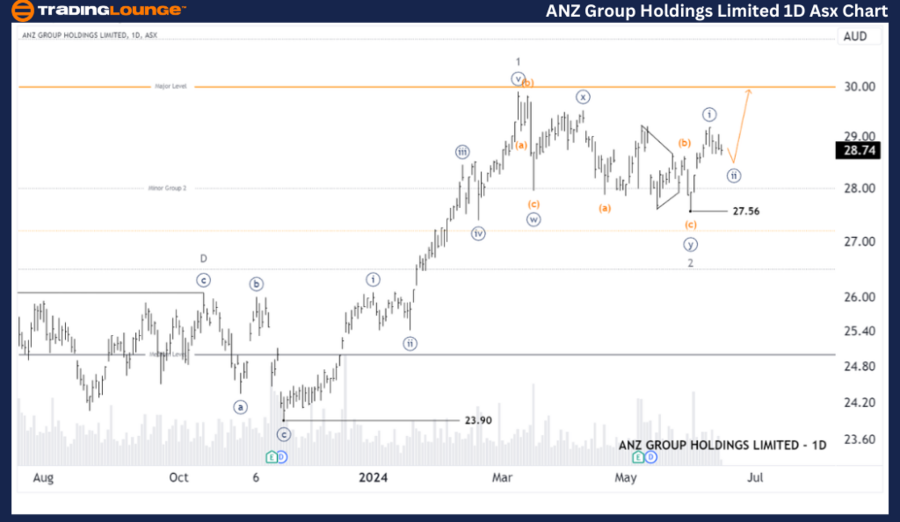
Our Elliott Wave analysis today updates the Australian Stock Exchange (ASX) with ANZ GROUP HOLDINGS LIMITED - ANZ. We identified wave 3-grey, which appears to be unfolding higher, subdividing into wave ((ii))-navy, presenting a Long Trade Setup opportunity.

ASX: ANZ GROUP HOLDINGS LIMITED - ANZ Elliott Wave Technical Analysis

ASX: ANZ GROUP HOLDINGS LIMITED - ANZ 1D Chart (Semilog Scale) Analysis

Function: Major trend (Minor degree, grey)

Mode: Motive

Structure: Impulse

Position: Wave ((ii))-navy of Wave 3-grey

Details: The short-term outlook indicates that wave 2-grey has ended. Since the low at 27.56, wave 3-grey is unfolding higher. The current price action subdivides into wave ((ii))-navy, pushing slightly lower, creating a long trade setup targeting wave ((iii))-grey.

Invalidation point: 27.56

ANZ-Group-holdings-L...


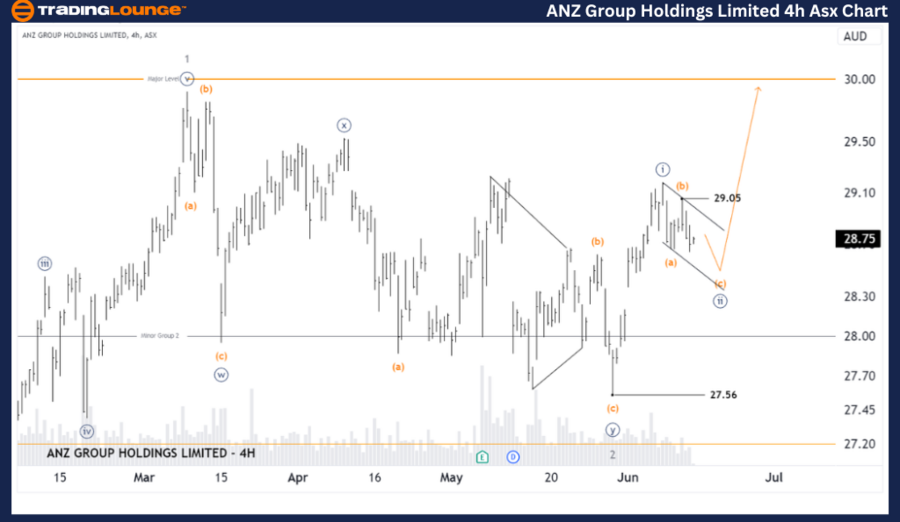
ASX: ANZ GROUP HOLDINGS LIMITED - TradingLounge (4-Hour Chart)

ANZ Elliott Wave Technical Analysis

ASX: ANZ GROUP HOLDINGS LIMITED - ANZ 4-Hour Chart Analysis

Function: Major trend (Minute degree, navy)

Mode: Motive

Structure: Impulse

Position: Wave (c)-orange of Wave ((ii))-navy

Details: The shorter-term outlook shows wave ((i))-navy completed, and wave ((ii))-navy is unfolding as an (a)(b)(c)-orange pattern. Wave (c)-orange appears to be pushing slightly lower, likely reaching the lower edge of the Channel. A push above the upper edge of the Channel will suggest wave ((iii))-navy is resuming.

Confirmation point: 29.05

Invalidation point: 27.56

Technical Analyst: Hua (Shane) Cuong, CEWA-M (Master’s Designation).

Source: visit Tradinglounge.com and learn From the Experts Join TradingLounge Here 

Previous: WESTPAC BANKING CORPORATION - WBC Elliott Wave Technical Analysis

Special Trial Offer - 0.76 Cents a Day for 3 Months! Click here

Access 7 Analysts Over 170 Markets Covered. Chat Room With Support

ANZ-Group-holdings-L...

Conclusion:
Our analysis and forecast of contextual trends and short-term outlook for ASX: ANZ GROUP HOLDINGS LIMITED - ANZ aim to provide insights into current market trends and how to capitalize on them effectively. We offer specific price points that act as validation or invalidation signals for our wave count, enhancing confidence in our perspective. By combining these factors, we strive to offer readers the most objective and professional perspective on market trends.

Related

Elliott Wave Analysis of ASX: CAR GROUP LIMITED – CAR Stock Forecast, Bullish Wave Structure, Price Targets & Trading Strategy

Elliott Wave Analysis of ASX: CAR GROUP LIMITED – CAR Stock Forecast, Bullish Wave Structure, Price Targets & Trading Strategy

Elliott Wave analysis of CAR GROUP LIMITED (ASX: CAR), identifying the completion of wave (4) and pr...

Read More >
Learn how to invest in Euro Stoxx 50 stocks: Euro Stoxx 50 Index Elliott Wave Technical Analysis

Learn how to invest in Euro Stoxx 50 stocks: Euro Stoxx 50 Index Elliott Wave Technical Analysis

Stay ahead in Euro Stoxx 50 trading with our comprehensive analysis. This report provides detailed E...

Read More >
Our detailed U.S.Dollar /Canadian Dollar (USD/CAD) Forex Elliott Wave Technical Analysis: Market Dynamics for this Currency Pair.

Our detailed U.S.Dollar /Canadian Dollar (USD/CAD) Forex Elliott Wave Technical Analysis: Market Dynamics for this Currency Pair.

Our detailed USD/CAD Elliott Wave analysis offers valuable insights into the current market dynamics...

Read More >
Deciphering BTCUSD Trends: A Comprehensive Bitcoin/ U.S. Dollar (BTCUSD) Elliott Wave technical Analysis

Deciphering BTCUSD Trends: A Comprehensive Bitcoin/ U.S. Dollar (BTCUSD) Elliott Wave technical Analysis

Latest insights on BTCUSD trends with our comprehensive Bitcoin/ U.S. Dollar (BTCUSD) Elliott Wave A...

Read More >
Saudi Arabian Market is Showing Strong Bullish Trends according to TASI Index Elliott Wave Technical Analysis

Saudi Arabian Market is Showing Strong Bullish Trends according to TASI Index Elliott Wave Technical Analysis

The TASI Index is showing strong bullish trends according to Elliott Wave analysis on both daily and...

Read More >

$1 for 2 Weeks

then $29 a month!

What a Special Offer!

Trade Recommendations

Unleash the power of deversified trading with our comprehensive portfolio, covering 250+ markets:

  • Stock Trades
  • Crypto Trades
  • Forex Trades
  • Commodity Trades
Elliott Wave Analysis

Gain a competitive edge with expert insights and AI-powered Elliott Wave charting into:

  • Global Indices
  • US Stocks & ASX Stocks
  • Forex & Crypto
  • Commodities
Top-Notch Trading Tools

Equip yourself with the tools of success:

  • Real-time Chat rooms
  • Elliott Wave Algorithm
  • Portfolio tools
  • TradingLevels
  • Screener
  • Trading Game
7 Elliott Wave Analysts

Stay ahead of the market with daily charts and insightful videos
Your secret to strategic trading!

JOIN HERE


Welcome to TradingLounge (ASIC A.R.No. 321187), specialists in trades, trading education and technical analysis, covering stocks, indices, commodities, forex and cryptocurrencies.

When you join TradingLounge you have access to everything we offer, including trade tools, educational content and a social platform to chat with like-minded investors.

Read more

@Copyright 2024 by tradinglounge.com

Contact Us

Australian no: 02 4787 6020

International no: +61 (2) 47876020

Pay with:

Find us on