TASI Index Elliott Wave Analysis Trading Lounge Day Chart
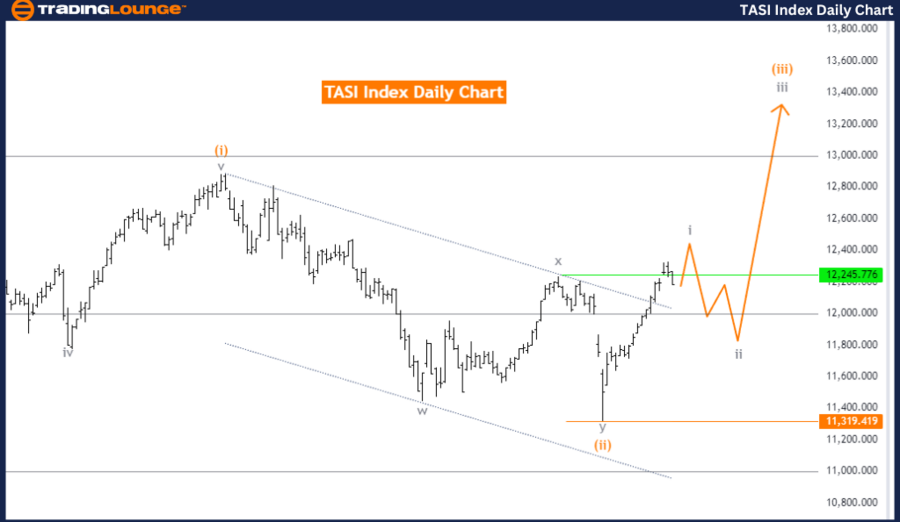
TASI Index Daily Chart Analysis
TASI Index Elliott Wave Technical Analysis
Function: Bullish Trend
Mode: Impulsive
Structure: Gray wave 1
Position: Orange wave 3
Direction Next Lower Degrees: Gray wave 2
Details: Orange Wave 2 is completed, and gray Wave 1 of orange Wave 3 is in progress.
Wave Cancel Invalid Level: 11319.419
The TASI Index demonstrates a bullish trend on the daily chart, supported by Elliott Wave analysis. The market is in an impulsive mode, indicative of robust movement in line with the prevailing trend. The key structure under observation is gray wave 1, with the current position in orange wave 3. This placement suggests the market is in the third wave of the orange wave sequence, typically the most potent and extended in an Elliott Wave cycle.
The analysis indicates the conclusion of orange wave 2, with gray wave 1 of orange wave 3 now unfolding. This transition implies the market has exited the corrective phase (orange wave 2) and is entering a new impulsive phase (gray wave 1 within orange wave 3). The development of gray wave 1 suggests increasing momentum, likely propelling the market upward as the wave progresses.
The next anticipated move involves a shift to gray wave 2 after gray wave 1 completes, marking a minor corrective phase within the broader impulsive trend of orange wave 3. However, the immediate focus remains on the progression of gray wave 1, which is expected to continue driving the market higher.
A critical level to monitor is 11319.419, the wave cancel invalid level. If the market dips to or below this level, the current wave structure would be invalidated, potentially indicating a change in market conditions or the need to reassess the wave count.
In summary, the TASI Index is in a bullish phase on the daily chart, advancing through gray wave 1 of orange wave 3. The crucial level to watch for invalidation of this wave structure is 11319.419.
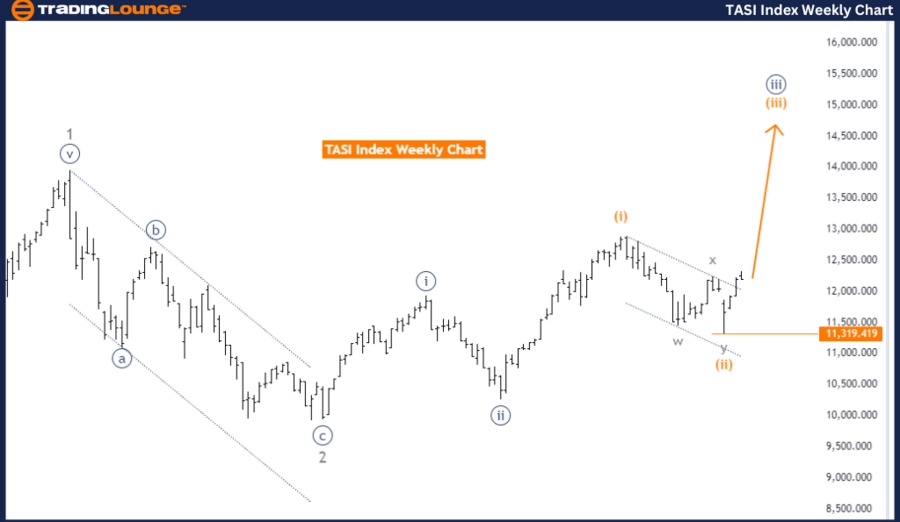
TASI Index Elliott Wave Analysis Trading Lounge Weekly Chart
TASI Index Weekly Chart Analysis
TASI Index Elliott Wave Technical Analysis
Function: Bullish Trend
Mode: Impulsive
Structure: Orange wave 3
Position: Navy Blue Wave 3
Direction Next Higher Degrees: Orange wave 3 continuation
Details: Orange wave 2 of 3 completed, orange wave 3 in progress.
Wave Cancel Invalid Level: 11319.419
The TASI Index is showing a bullish trend on the weekly chart, according to Elliott Wave analysis. The market is in an impulsive mode, indicating strong upward movement within the broader trend. The primary structure under review is orange wave 3, with the current position marked as navy blue wave 3 within this structure. This position suggests that the market is in the third wave of the navy blue wave sequence, typically a strong and extended phase in an Elliott Wave cycle.
The analysis suggests that orange wave 2 of 3 has concluded, signaling the end of a corrective phase and the beginning of a new advance within orange wave 3. This phase is expected to drive the market higher, reflecting strong momentum and further gains within the ongoing trend.
The direction for the next higher degrees suggests that orange wave 3 is likely to continue, reinforcing the bullish outlook for the market. This ongoing wave indicates that the upward movement is not yet complete, with further advancements expected as the wave unfolds.
A key level to watch is 11319.419, identified as the wave cancel invalid level. If the market falls to or below this level, it would invalidate the current wave structure, possibly signaling a reversal or the need to re-evaluate the Elliott Wave count.
In summary, the TASI Index is in a bullish phase on the weekly chart, progressing through navy blue wave 3 within orange wave 3. The critical level to monitor for invalidation of this wave structure is 11319.419.
Technical Analyst: Malik Awais
Source: visit Tradinglounge.com and learn From the Experts Join TradingLounge Here
Previous: Nikkei 225 Index Elliott Wave Technical Analysis
Special Trial Offer - 0.76 Cents a Day for 3 Months! Click here
Access 7 Analysts Over 200 Markets Covered. Chat Room With Support