Euro/British Pound Currency Pair Analysis TradingLounge Day Chart,
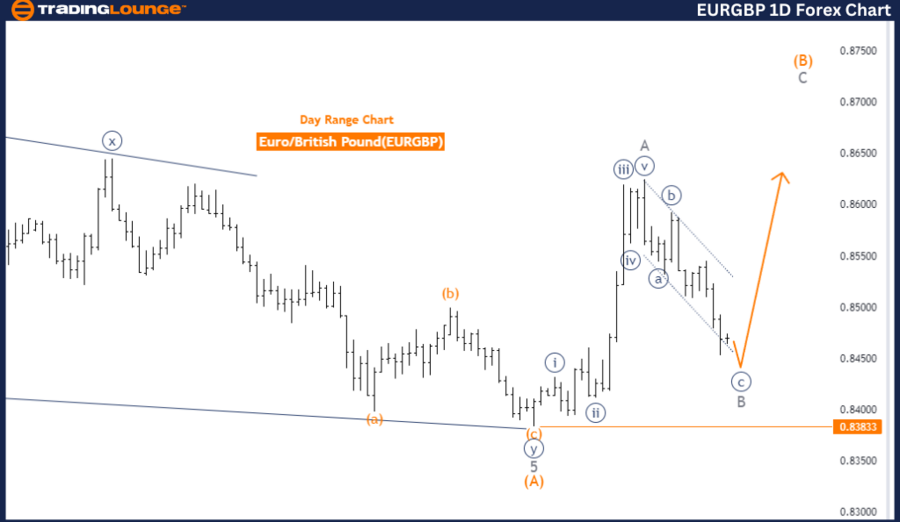
Euro/British Pound (EUR/GBP) Day Chart Analysis
EUR/GBP Elliott Wave Technical Analysis
- Function: Counter Trend
- Mode: Corrective
- Structure: Navy Blue Wave C
- Position: Gray Wave B
- Direction Next Higher Degrees: Gray Wave C
- Details: Navy Blue Wave B appears completed, with Navy Blue Wave C now in progress.
- Wave Cancel Invalid Level: 0.83833
The EUR/GBP pair is currently undergoing a counter-trend phase according to Elliott Wave theory on the daily chart. This analysis shows the market in a corrective mode, implying a temporary move against the dominant trend. The identified structure is Navy Blue Wave C, which generally follows after the completion of a corrective wave sequence.
Currently, the market is situated within Gray Wave B, which is nearing its completion. This suggests that the price pullback or retracement associated with the corrective phase is almost over. Upon the conclusion of Navy Blue Wave B, the market is expected to enter Navy Blue Wave C, indicating the continuation of the corrective phase. In this phase, the price moves against the primary trend before possibly resuming its original direction.
The next higher degree movement aligns with Gray Wave C, suggesting that the corrective phase will likely extend as the market progresses through Navy Blue Wave C. This phase is crucial for traders as it may provide opportunities to identify potential reversal points or to position themselves for the next major market move.
A critical level to monitor is 0.83833, which is identified as the wave cancel invalid level. If the market drops below this level, it would invalidate the current wave count, indicating a possible shift in market direction. This level is essential for confirming whether the ongoing corrective wave structure will hold or if a new trend may develop.
In summary, the EUR/GBP pair is in a corrective phase within a counter-trend mode, transitioning from Navy Blue Wave B to Navy Blue Wave C. The continuation of this phase depends on the market staying above the crucial level of 0.83833, which serves as a validation point for the current wave structure.
EUR/GBP Elliott Wave Analysis Trading Lounge 4-Hour Chart
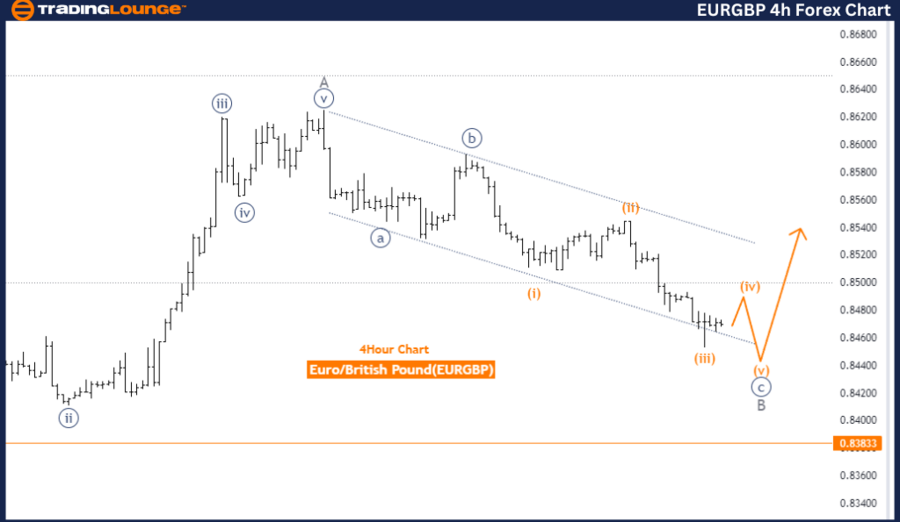
Euro/British Pound (EUR/GBP) 4-Hour Chart Analysis
EUR/GBP Elliott Wave Technical Analysis
- Function: Counter Trend
- Mode: Corrective
- Structure: Navy Blue Wave C
- Position: Gray Wave B
- Direction Next Higher Degrees: Gray Wave C
- Details: Navy Blue Wave B appears completed, with Navy Blue Wave C now in progress.
- Wave Cancel Invalid Level: 0.83833
The EUR/GBP pair is in a counter-trend phase, as analyzed using Elliott Wave theory on the 4-hour chart. This analysis indicates that the market is in a corrective mode, suggesting a temporary reversal within a larger trend. The observed structure is Navy Blue Wave C, part of a corrective wave sequence following a counter-trend move.
At this stage, the market is positioned within Gray Wave B, which is nearing its completion. This suggests that the corrective phase, including a price pullback or retracement, is almost over. Once Navy Blue Wave B completes, the market is expected to transition into Navy Blue Wave C, marking the next phase in the corrective sequence. This phase typically involves movement opposite to the prior trend, often seen as the continuation or completion of the corrective pattern before the market resumes its previous trend direction.
The direction of the next higher degrees aligns with the continuation of Gray Wave C, indicating further corrective movements as the market progresses through Navy Blue Wave C. This stage is crucial for traders looking to identify potential reversal points or opportunities to position themselves for the next significant trend.
A critical level to monitor is 0.83833, identified as the wave cancel invalid level. If the market falls below this level, it would suggest that the current wave count and anticipated corrective movement might be invalidated, signaling a potential shift in the market’s direction. This level serves as a key reference point for confirming the continuation of the corrective phase.
In summary, EUR/GBP is in a corrective phase within a counter-trend mode, with Navy Blue Wave C currently active following the completion of Navy Blue Wave B. The market is expected to continue its corrective movement, with 0.83833 serving as a critical level to watch for the validity of the current wave structure.
Technical Analyst: Malik Awais
Source: visit Tradinglounge.com and learn From the Experts Join TradingLounge Here
Previous: USDCHF Elliott Wave Technical Analysis
Special Trial Offer - 0.76 Cents a Day for 3 Months! Click here
Access 7 Analysts Over 200 Markets Covered. Chat Room With Support