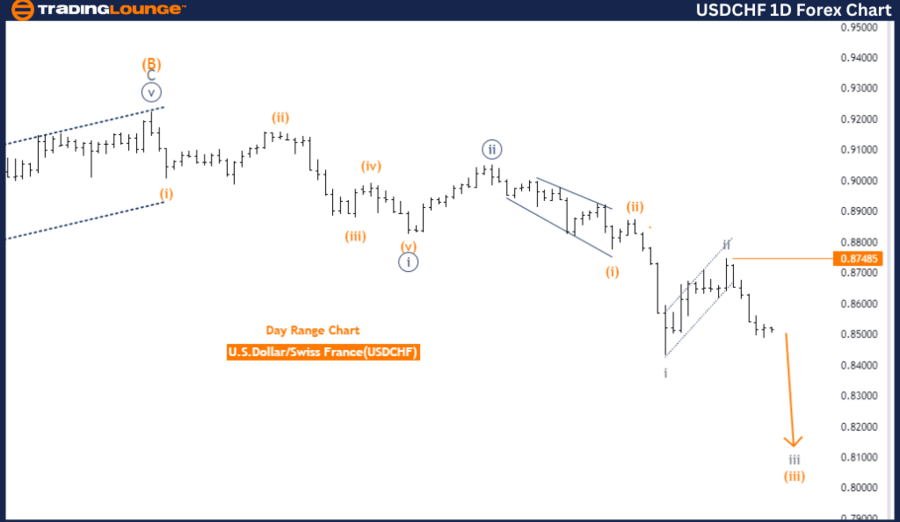
U.S. Dollar/Swiss Franc Elliott Wave Analysis TradingLounge Day Chart,
USDCHF Day Chart Analysis
USDCHF Elliott Wave Technical Analysis
- Function: Trend
- Mode: Impulsive
- Structure: Gray Wave 3
- Position: Orange Wave 3
- Direction Next Lower Degrees: Orange Wave 3 (started)
- Details: Gray Wave 2 appears complete; Gray Wave 3 is now in progress.
- Wave Cancel Invalid Level: 0.87485
The USDCHF currency pair is showing a strong trend based on Elliott Wave analysis on the daily chart. The market is currently in an impulsive phase, which indicates a decisive movement in the direction of the primary trend. The main wave structure under analysis is Gray Wave 3, a critical stage in the Elliott Wave sequence that often corresponds with significant price movements and momentum.
Presently, the market's position is within Orange Wave 3, a segment of the broader Gray Wave 3 structure. This suggests that the currency pair is experiencing a strong downward movement, as Wave 3 is typically one of the most extended and powerful waves in the Elliott Wave pattern. The completion of Gray Wave 2 suggests that the corrective phase has ended, and the market has now transitioned into the next impulsive phase, specifically Gray Wave 3.
The analysis indicates that Orange Wave 3 has already begun, signaling an expected continuation of the downward trajectory as this wave progresses. The trend direction for the next lower degrees aligns with the movement of Orange Wave 3, further supporting the anticipation of ongoing downward momentum in the market.
A crucial level to monitor is 0.87485, identified as the wave cancel invalid level. If the price falls below this level, it would invalidate the current wave count, indicating that the expected wave structure is no longer applicable. This level serves as a vital benchmark to confirm the validity of the ongoing Elliott Wave analysis.
In summary, the USDCHF pair is currently in a strong downward trend, with Gray Wave 3 progressing within the broader Orange Wave 3 structure. The completion of Gray Wave 2 suggests the market is set for further declines, with the key level of 0.87485 acting as an important indicator for the continuation of this wave structure.
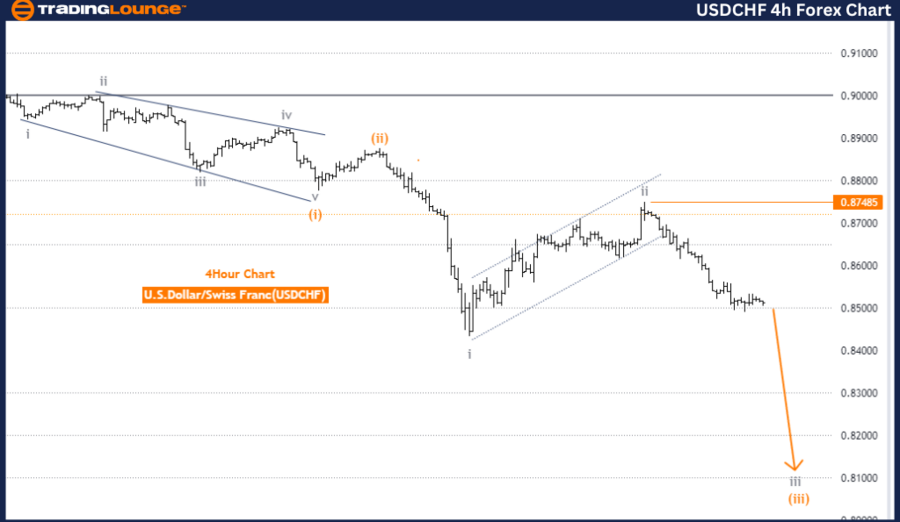
USDCHF Elliott Wave Analysis Trading Lounge 4-Hour Chart
U.S. Dollar / Swiss Franc 4-Hour Chart Analysis
USDCHF Elliott Wave Technical Analysis
- Function: Trend
- Mode: Impulsive
- Structure: Gray Wave 3
- Position: Orange Wave 3
- Direction Next Lower Degrees: Orange Wave 3 (started)
- Details: Gray Wave 2 appears complete; Gray Wave 3 is now in progress.
- Wave Cancel Invalid Level: 0.87485
The USDCHF pair is currently displaying a strong trend according to Elliott Wave analysis on the 4-hour chart. The market is in an impulsive mode, suggesting that the price is moving decisively in the direction of the main trend. The primary wave structure under observation is Gray Wave 3, an essential part of the impulsive phase, often characterized by significant price movements.
Currently, the market is positioned within Orange Wave 3, a key segment of the ongoing Gray Wave 3 structure. This suggests that the pair is experiencing a strong downward movement, as Wave 3 is typically the most powerful and extended wave in the Elliott Wave sequence. The completion of Gray Wave 2 indicates that the corrective phase has ended, and the market has now entered the next impulsive phase, specifically Gray Wave 3.
The analysis emphasizes that Orange Wave 3 has already commenced, indicating that the market is likely to continue its downward trajectory as this wave progresses. The trend direction for the next lower degrees remains aligned with Orange Wave 3, further reinforcing the expectation of continued strength in the market.
A critical level to watch is 0.87485, identified as the wave cancel invalid level. If the price drops below this level, it would invalidate the current wave count, suggesting that the anticipated wave structure is no longer valid. This level serves as an important benchmark for the accuracy of the ongoing Elliott Wave analysis.
In summary, the USDCHF pair is in a robust downward trend, with Gray Wave 3 currently in progress within Orange Wave 3. The completion of Gray Wave 2 suggests the market is poised for further gains, with 0.87485 as a key level to validate the current wave structure.
Technical Analyst: Malik Awais
Source: visit Tradinglounge.com and learn From the Experts Join TradingLounge Here
Previous: GBPUSD Elliott Wave Technical Analysis
Special Trial Offer - 0.76 Cents a Day for 3 Months! Click here
Access 7 Analysts Over 200 Markets Covered. Chat Room With Support