Overview of BNBUSD Elliott Wave Technical Analysis TradingLounge Daily and 4H Chart

Elliott Wave Theory offers a structured approach to trading, particularly highlighting potential price movements in financial markets. In the case of the Binance/US Dollar (BNBUSD), the current analysis points to a counter-trend mode with a corrective structure, primarily shaped in a triangle pattern. This analysis pertains to Wave ((D)) which is part of a larger sequence anticipated to move towards Wave 4.

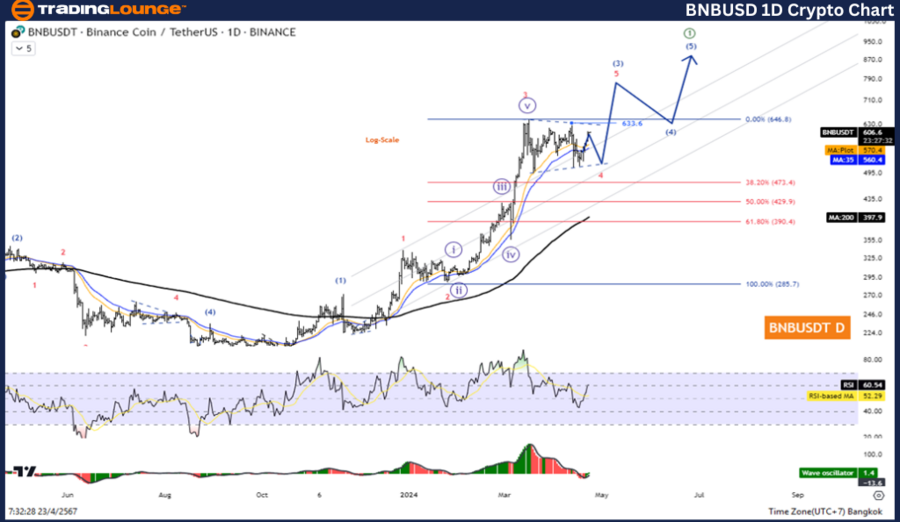
Elliott Wave Analysis TradingLounge Daily Chart, 

Binance/ U.S. dollar(BNBUSD) Chart Analysis

BNBUSD Elliott Wave Technical Analysis

Function: Counter Trend

Mode: Corrective

Structure: Triangle

Position: Wave ((D))

Direction Next higher Degrees: wave 4

Wave Cancel invalid level: 508

Details: Correction in Triangle pattern before rising again in Wave 5.

Binance/ U.S. dollar(BNBUSD)Trading Strategy:

The short-term correction in Wave 4 with the Triangle pattern continues. Because there is still another decrease in wave E before an increase in wave 5, so wait for the correction to complete to look for opportunities to join the trend again.

Binance/ U.S. dollar(BNBUSD)Technical Indicators: The price is above the MA200 indicating an Uptrend, and The Wave Oscillator is a Bullish Momentum.

BNBUSD-1D-crypto-cha...


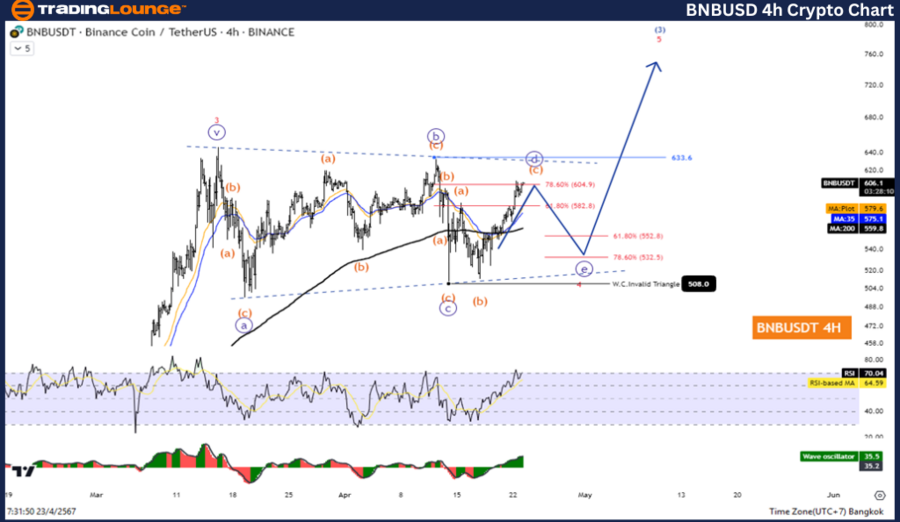
BNBUSD Elliott Wave Analysis TradingLounge H4 Chart,

Binance/ U.S. dollar(BNBUSD) H4 Chart Analysis

BNBUSD Elliott Wave Technical Analysis

Function: Counter Trend

Mode: Corrective

Structure: Triangle

Position: Wave ((D))

Direction Next higher Degrees: wave 4

Wave Cancel invalid level: 508

Details: Correction in Triangle pattern before rising again in Wave 5.

Binance/ U.S. dollar(BNBUSD)Trading Strategy:

The short-term correction in Wave 4 with the Triangle pattern continues. Because there is still another decrease in wave E before an increase in wave 5, so wait for the correction to complete to look for opportunities to join the trend again.

Binance/ U.S. dollar(BNBUSD)Technical Indicators: The price is above the MA200 indicating an uptrend, The Wave Oscillator is a Bullish Momentum.

Conclusion: Preparing for the Next Market Phase in BNBUSD

As the BNBUSD market navigates through its Elliott Wave cycle, particularly through the corrective triangle pattern, both traders and investors should prepare for the upcoming bullish phase. Understanding the intricacies of Wave ((D)) and the transition into Wave 5 is critical in positioning for the next significant price movement. Keeping an eye on critical technical indicators and the wave invalidation level will ensure readiness to capitalize on opportunities that arise as the market dynamics evolve.

Technical Analyst: Kittiampon Somboonsod

Source: visit Tradinglounge.com and learn From the Experts Join TradingLounge Here 

See Previous:  Dogecoin/U.S. Dollar (DOGEUSD)

TradingLounge's Free Week Extravaganza!

April 14 – 21: Unlock the Doors to Trading Excellence — Absolutely FREE

BNBUSD-4Hr-crypto-ch...

Related

Unlocking ASX Trading Success: V300AEQ ETF UNITS – VAS Stock Analysis & Elliott Wave Technical Forecast

Unlocking ASX Trading Success: V300AEQ ETF UNITS – VAS Stock Analysis & Elliott Wave Technical Forecast

This article provides a detailed Elliott Wave analysis of ASX: V300AEQ ETF (VAS), focusing on curren...

Read More >
S&P 500, NASDAQ 100, BITCOIN, DAX 40, FTSE 100, ASX 200: Technical Analysis

S&P 500, NASDAQ 100, BITCOIN, DAX 40, FTSE 100, ASX 200: Technical Analysis

Bitcoin testing ATH, While the SP500 is completing an Elliott Wave 4 Triangle pattern. With US Stock...

Read More >
Trading opportunities within the Currency pair: GBPJPY Elliott Wave Technical Analysis on daily and 4-hour charts

Trading opportunities within the Currency pair: GBPJPY Elliott Wave Technical Analysis on daily and 4-hour charts

Strategic insights into GBPJPY trading with Elliott Wave Analysis, focusing on counter-trend opportu...

Read More >
NEWMONT CORPORATION - NEM Stock Analysis & Elliott Wave Technical Forecast, Price Targets, & Trading Strategy

NEWMONT CORPORATION - NEM Stock Analysis & Elliott Wave Technical Forecast, Price Targets, & Trading Strategy

Newmont Corporation (ASX:NEM) advances in a strong wave three. Get key Elliott Wave targets, critica...

Read More >
Ultratech Cement Elliott Wave Analysis: Stock Forecast Predicts Bullish Breakout After Current Correction on Daily and Weekly Charts

Ultratech Cement Elliott Wave Analysis: Stock Forecast Predicts Bullish Breakout After Current Correction on Daily and Weekly Charts

ULTRATECH CEMENT is in a corrective phase within a broader bullish trend. After the current correcti...

Read More >

$1 for 2 Weeks

then $29 a month!

What a Special Offer!

Trade Recommendations

Unleash the power of deversified trading with our comprehensive portfolio, covering 250+ markets:

  • Stock Trades
  • Crypto Trades
  • Forex Trades
  • Commodity Trades
Elliott Wave Analysis

Gain a competitive edge with expert insights and AI-powered Elliott Wave charting into:

  • Global Indices
  • US Stocks & ASX Stocks
  • Forex & Crypto
  • Commodities
Top-Notch Trading Tools

Equip yourself with the tools of success:

  • Real-time Chat rooms
  • Elliott Wave Algorithm
  • Portfolio tools
  • TradingLevels
  • Screener
  • Trading Game
7 Elliott Wave Analysts

Stay ahead of the market with daily charts and insightful videos
Your secret to strategic trading!

JOIN HERE


Welcome to TradingLounge (ASIC A.R.No. 321187), specialists in trades, trading education and technical analysis, covering stocks, indices, commodities, forex and cryptocurrencies.

When you join TradingLounge you have access to everything we offer, including trade tools, educational content and a social platform to chat with like-minded investors.

Read more

@Copyright 2024 by tradinglounge.com

Contact Us

Australian no: 02 4787 6020

International no: +61 (2) 47876020

Pay with:

Find us on