AUDUSD Elliott Wave Analysis Trading Lounge 4-Hour Chart
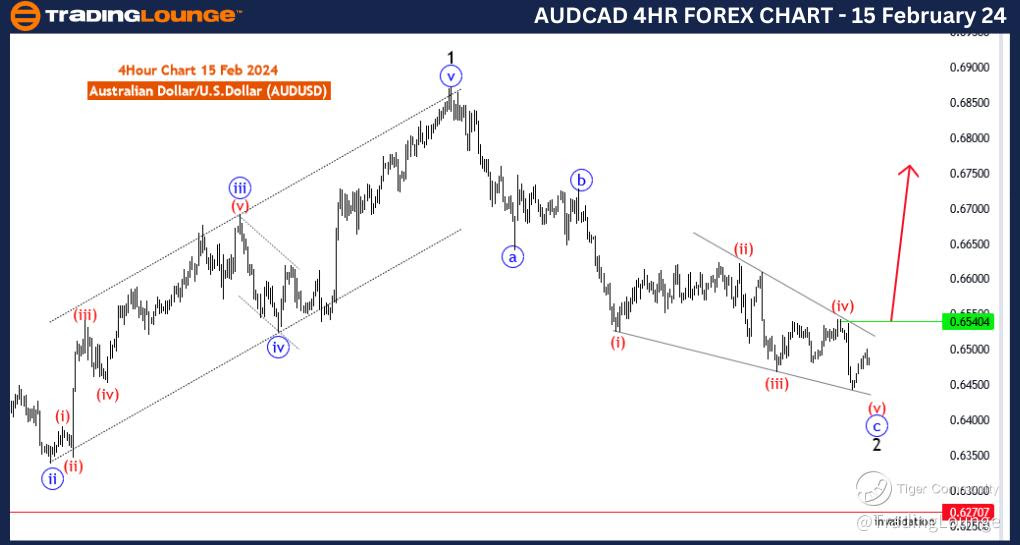
Australian Dollar/U.S.Dollar (AUDUSD) 4 Hour Chart
AUDUSD Elliott Wave Technical Analysis
FUNCTION: Counter Trend as Wave 2
MODE: Corrective
STRUCTURE: Ending Diagonal as wave C
POSITION: Red wave 3
DIRECTION NEXT HIGHER DEGREES: black wave 3
DETAILS: blue wave C of 2 is in play and looking near to end as ending diagonal diagonal .
Wave Cancel invalid level: 0.62707
The "AUDUSD Elliott Wave Analysis Trading Lounge 4 Hour Chart" dated 15 February 24, provides a detailed exploration of the Australian Dollar/U.S. Dollar (AUDUSD) currency pair within the context of Elliott Wave theory. This analysis primarily focuses on the 4-hour timeframe, aiming to equip traders with valuable insights for navigating the market.
The identified "FUNCTION" is "Counter Trend as wave 2," indicating that the analysis is geared towards understanding a potential corrective phase within the broader market trend. Counter-trend movements often present traders with opportunities to identify reversals or continuations of the primary trend.
The specified "MODE" is "Corrective," signifying that the market is currently undergoing a corrective wave. Corrective waves are characterized by price movements that run counter to the primary trend and are essential for traders seeking to understand potential reversals or trend continuations.
The described "STRUCTURE" is an "Ending Diagonal as wave C," indicating a specific Elliott Wave pattern in play. Ending diagonals are a type of motive wave that unfolds in five overlapping waves, often signaling the termination of the larger movement.
The designated "POSITION" is "Red wave 3," specifying the current position within the Elliott Wave hierarchy. This information assists traders in understanding where the market is within the larger wave count and facilitates the identification of potential trade setups.
Concerning "DIRECTION NEXT HIGHER DEGREES," the analysis points to "black wave 3," suggesting the anticipated direction of the next higher-degree wave. This hierarchical approach aids traders in gaining a comprehensive view of potential future price movements.
In the "DETAILS" section, it is noted that "blue wave C of 2" is currently in play and is approaching its end as an ending diagonal. Additionally, a "Wave Cancel invalid level" is specified as "0.62707," providing traders with a critical reference point. This level acts as an invalidation point, and a breach could signal a shift in the anticipated wave count.
In summary, the AUDUSD Elliott Wave Analysis for the 4-hour chart on 15 February 24, suggests the presence of a corrective phase (wave 2) characterized by an ending diagonal pattern (wave C of 2). Traders are advised to closely monitor the market, especially the specified invalidation level at 0.62707, for potential shifts in market dynamics.
Technical Analyst: Malik Awais

AUDUSD Elliott Wave Analysis Trading Lounge Day Chart, 15 February 24
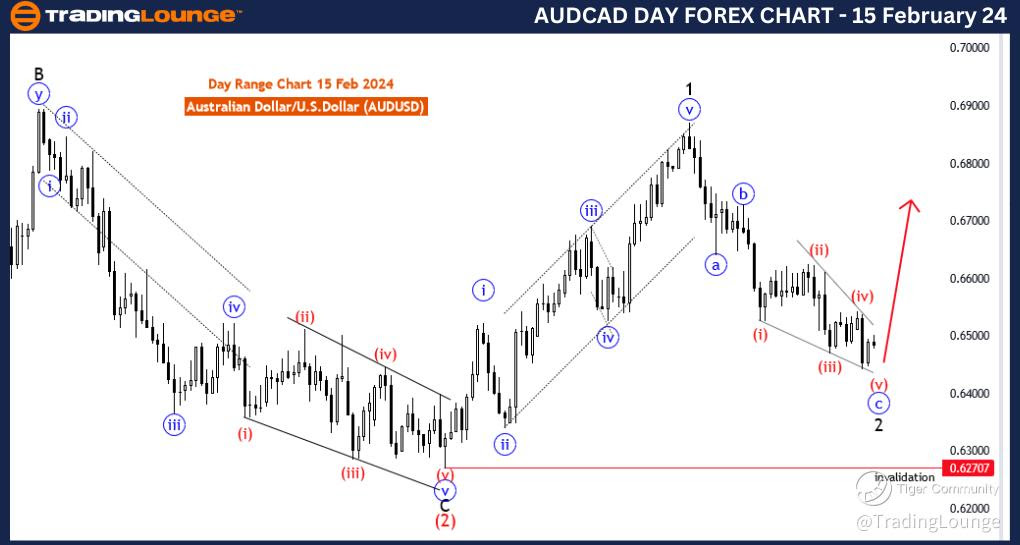
Australian Dollar/U.S.Dollar (AUDUSD) Day Chart
AUDUSD Elliott Wave Technical Analysis
FUNCTION: Counter Trend as wave 2
MODE: Corrective
STRUCTURE: blue wave C of 2
POSITION: Red wave 3
DIRECTION NEXT HIGHER DEGREES: black wave 3
DETAILS: blue wave C of 2 is in play and looking near to end as ending diagonal diagonal . Wave Cancel invalid level: 0.62707
The "AUDUSD Elliott Wave Analysis Trading Lounge Day Chart" dated 15 February 24, delves into the intricate dynamics of the Australian Dollar/U.S. Dollar (AUDUSD) currency pair, utilizing Elliott Wave theory. Focused on the daily chart, this analysis provides a comprehensive understanding of potential price movements for traders seeking strategic insights.
The identified "FUNCTION" is "Counter Trend as wave 2," indicating that the analysis is primarily concerned with a corrective phase within the broader market trend. This insight is crucial for traders looking to navigate potential reversals or continuations in the market.
The specified "MODE" is "Corrective," signaling that the market is currently undergoing a corrective wave. Corrective waves are essential in understanding temporary price movements that deviate from the primary trend, providing traders with opportunities for strategic decision-making.
The described "STRUCTURE" is "blue wave C of 2," detailing a specific Elliott Wave pattern in progress. The analysis suggests that blue wave C of 2 is currently in play and is approaching its culmination, with a notable emphasis on it manifesting as an "ending diagonal diagonal." Ending diagonals are motive waves characterized by overlapping price movements and typically signal a forthcoming trend reversal.
The designated "POSITION" is "Red wave 3," revealing the current position within the Elliott Wave hierarchy. This information aids traders in situating the market within the broader wave count, contributing to a comprehensive understanding of potential trade setups.
Concerning "DIRECTION NEXT HIGHER DEGREES," the analysis points to "black wave 3," indicating the expected direction of the next higher-degree wave. This hierarchical perspective is instrumental in providing traders with a holistic view of potential future price movements.
In the "DETAILS" section, it is emphasized that "blue wave C of 2" is currently in play and is reaching its conclusion, particularly as an ending diagonal. Additionally, a critical "Wave Cancel invalid level" is specified at "0.62707." This level acts as a key reference point, with a breach potentially signaling a shift in the anticipated wave count.
In conclusion, the AUDUSD Elliott Wave Analysis for the daily chart on 15 February 24, indicates the presence of a corrective phase (wave 2), specifically within blue wave C of 2, and underscores the significance of an ending diagonal pattern. Traders are advised to closely monitor the market, particularly the specified invalidation level at 0.62707, for potential shifts in market dynamics.
Technical Analyst: Malik Awais
Source: visit Tradinglounge.com and learn From the Experts Join TradingLounge Here
See Previous: New Zealand Dollar/U.S. Dollar (NZDUSD)
