Costco Wholesale Corp., Elliott Wave Technical Analysis
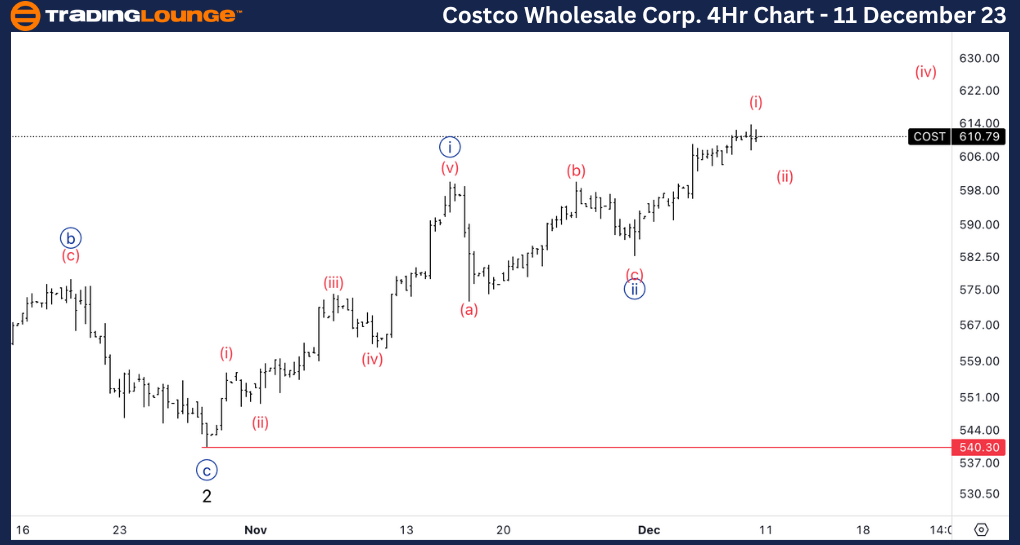
Costco Wholesale Corp., (COST:NASDAQ): 4h Chart 11 December 23
COST Stock Market Analysis: We have been monitoring the upside in Costco as we seemed to have a group of waves 1-2 nesting. We are now looking at a count that suggests Minute wave {ii} is in place and we are now waiting for a pullback in wave (ii) to then look for longs.
COST Elliott Wave Count: Wave (i) of {iii}.
COST Technical Indicators: Above all averages.
COST Trading Strategy: Looking for longs after a pullback in wave (ii).
TradingLounge Analyst: Alessio Barretta
Source: Tradinglounge.com get trial here!

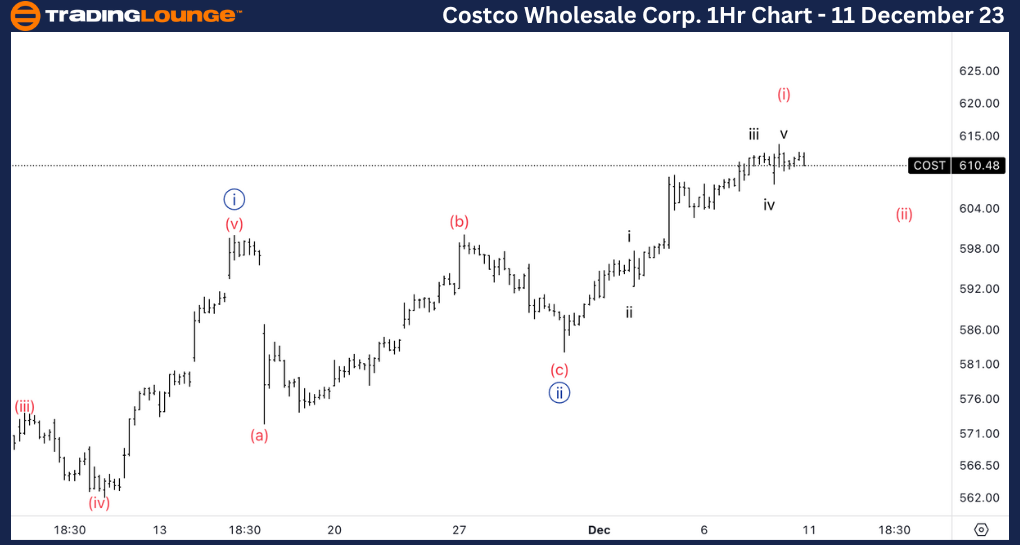
Costco Wholesale Corp., COST: 1-hour Chart 11 December 23
Costco Wholesale Corp., Elliott Wave Technical Analysis
COST Stock Market Analysis: Looking for a potential top already in wave (i), if not we could be close. After that we could see further downside into wave (ii) to then find support on 600$.
COST Elliott Wave count: Wave v of (i).
COST Technical Indicators: Above all averages.
COST Trading Strategy: Looking for longs after a pullback in wave (ii).
