Gold Elliott Wave Analysis: Unraveling the Current Bullish Trend

Gold Elliott wave Technical analysis

Function: Trend

Mode: Impulse

Structure: Impulse wave

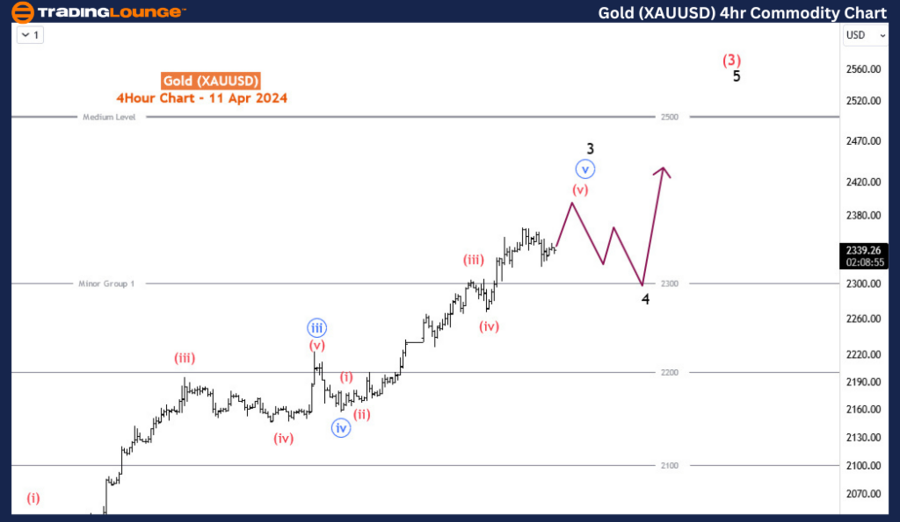
Position: Wave (v) of 3

Direction: Wave 4 pullback

Details: Anticipation of a wave 4 dip, paving the way for further advancements in wave 5. The possibility remains that wave 3 could extend further, indicating that the bullish momentum in gold prices is far from over.

The analysis of gold prices through the Elliott Wave lens reveals a robust bullish pattern across various chart timeframes, consistently setting new benchmarks beyond previous all-time highs. The inception of this bullish phase can be traced back to December 2015, marking the end of a 51-month bearish correction that spanned from August 2011 to December 2015. This correction phase was succeeded by an expansive bullish impulse that began in August 1999 and lasted for an impressive 144 months. Prior to this, the gold market experienced a bearish correction phase that stretched over 236 months starting from January 1980, following a bullish trend that originated in the 1970s. This cyclical nature of gold prices, characterized by alternating waves of impulse and correction, suggests that the current bullish wave, now over 100 months in duration, is likely to continue based on historical patterns.

A Closer Look at Gold's Bullish Impulse Since 2015

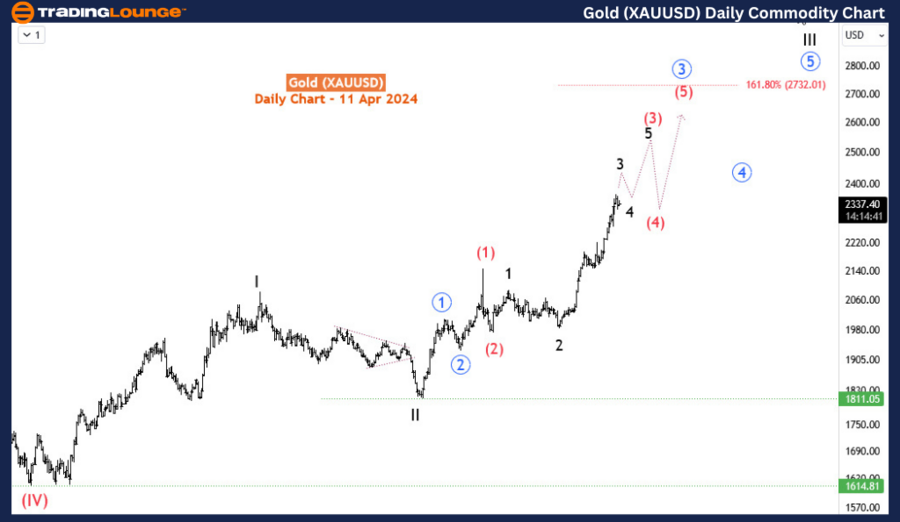
Gold Day Chart Analysis

Today’s analysis delves deep into the ongoing bullish impulse cycle that started in 2015, shedding light on the potential future movements of gold prices.

On the daily chart, we identify this phase as part of the supercycle wave (IV), with the current position within the cycle degree wave III of (IV). Utilizing Fibonacci projections, we deduce that wave III could potentially extend to the 161.8% projection of wave I from II, aiming for a long-term target of 2732. This projection offers a glimpse into the optimistic future that awaits gold investors. Presently, gold's price progression is in the sub-phase of wave 3 of (3) of the third blue wave of III, with several subsequent waves required to reach the aforementioned target. The emergence of a new buying opportunity is projected post-wave 4, especially with wave 3 nearing completion.\

Gold-XAUUSD-1D-commo...


TradingLounge Commodities Elliott Wave Analysis of Gold

Gold 4-Hour Chart Analysis

Transitioning to the H4 timeframe, the culmination of wave 3, especially its final leg marked as wave (v) of the third blue wave, is evident with the breach above the 2300 medium level. Price movements are currently fluctuating between the 2300 and 2500 medium levels. Should wave 3 wrap up its final stages, a retracement to wave 4 around the 2300 level is anticipated before a resurgence towards 2500 in wave 5. This scenario presents a strategic buying opportunity during the dip of wave 4, especially near the 2300 mark. Such a strategy enables traders to leverage the continuing bullish trend in gold while navigating the market with increased accuracy.

Technical Analyst: Sanmi Adeagbo

Source: visit Tradinglounge.com and learn From the Experts Join TradingLounge Here 

See Previous: WTI Crudeoil 

TradingLounge Once Off SPECIAL DEAL: Here > 1 month Get 3 months

TradingLounge's Free Week Extravaganza!

April 14 – 21: Unlock the Doors to Trading Excellence — Absolutely FREE

Gold-XAUUSD-4hr-comm...

Related

Euro/ U.S. Dollar (EURUSD) Forex Elliott Wave Technical Analysis: Daily and 4-Hour Chart Insights for Effective Forex Trading

Euro/ U.S. Dollar (EURUSD) Forex Elliott Wave Technical Analysis: Daily and 4-Hour Chart Insights for Effective Forex Trading

This comprehensive EURUSD Elliott Wave Analysis covers both daily and 4-hour charts, offering in-dep...

Read More >
ADANI PORTS & SEZ Indian Stocks Elliott Wave Forecast: Bullish Impulse Wave 3 with Key Support Level and Price Prediction Update

ADANI PORTS & SEZ Indian Stocks Elliott Wave Forecast: Bullish Impulse Wave 3 with Key Support Level and Price Prediction Update

This detailed Elliott Wave analysis highlights a bullish trend for Adani Ports & SEZ, focusing on wa...

Read More >
Comprehensive Mahindra & Mahindra Stock Analysis and Elliott Wave Forecast for Future Share Price Predictions

Comprehensive Mahindra & Mahindra Stock Analysis and Elliott Wave Forecast for Future Share Price Predictions

Explore Mahindra & Mahindra stock analysis with detailed Elliott Wave analysis, share price predicti...

Read More >
WTC Stock with Precise Technical Chart Analysis and Expert Market Forecasts: WiseTech Global Limited Elliott Wave Technical Forecast

WTC Stock with Precise Technical Chart Analysis and Expert Market Forecasts: WiseTech Global Limited Elliott Wave Technical Forecast

Explore our comprehensive Elliott Wave analysis of WiseTech Global Limited (WTC) on the ASX. Underst...

Read More >
Maruti Suzuki India Stock Prediction: In-Depth Elliott Wave Technical  Analysis and Market Trends

Maruti Suzuki India Stock Prediction: In-Depth Elliott Wave Technical Analysis and Market Trends

This article provides a detailed Elliott Wave analysis of Maruti Suzuki stock. It covers key technic...

Read More >
Ripple (XRPUSD) Elliott Wave Analysis Predicts Reversal as Wave 2 Nears Completion – Key Price Levels and Swing Strategy Inside

Ripple (XRPUSD) Elliott Wave Analysis Predicts Reversal as Wave 2 Nears Completion – Key Price Levels and Swing Strategy Inside

This analysis shows XRP in Wave 2 correction nearing completion. Traders should watch for a reversal...

Read More >

$1 for 2 Weeks

then $29 a month!

What a Special Offer!

Trade Recommendations

Unleash the power of deversified trading with our comprehensive portfolio, covering 250+ markets:

  • Stock Trades
  • Crypto Trades
  • Forex Trades
  • Commodity Trades
Elliott Wave Analysis

Gain a competitive edge with expert insights and AI-powered Elliott Wave charting into:

  • Global Indices
  • US Stocks & ASX Stocks
  • Forex & Crypto
  • Commodities
Top-Notch Trading Tools

Equip yourself with the tools of success:

  • Real-time Chat rooms
  • Elliott Wave Algorithm
  • Portfolio tools
  • TradingLevels
  • Screener
  • Trading Game
7 Elliott Wave Analysts

Stay ahead of the market with daily charts and insightful videos
Your secret to strategic trading!

JOIN HERE


Welcome to TradingLounge (ASIC A.R.No. 321187), specialists in trades, trading education and technical analysis, covering stocks, indices, commodities, forex and cryptocurrencies.

When you join TradingLounge you have access to everything we offer, including trade tools, educational content and a social platform to chat with like-minded investors.

Read more

@Copyright 2024 by tradinglounge.com

Contact Us

Australian no: 02 4787 6020

International no: +61 (2) 47876020

Pay with:

Find us on