WTI Crudeoil Commodities Elliott wave Technical analysis
WTI Crudeoil Elliott wave Technical analysis
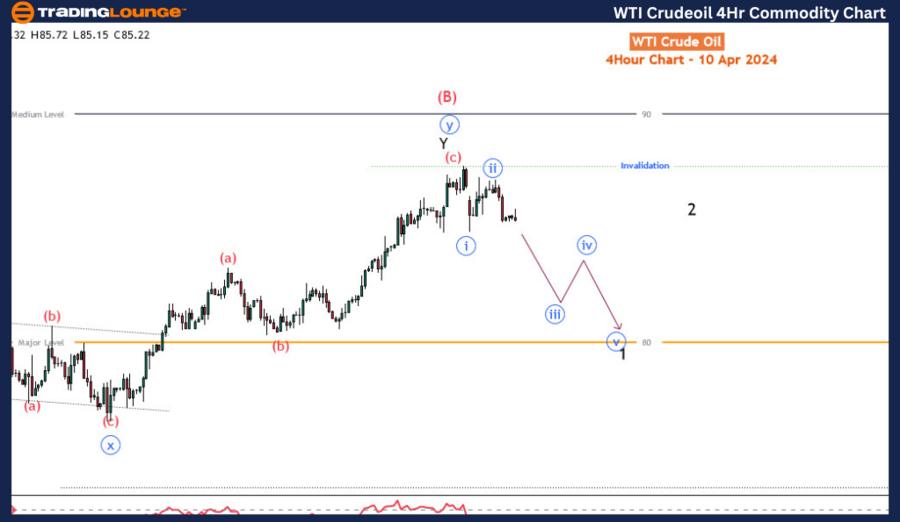
Function - Counter-trend
Mode - Corrective
Structure - Zigzag
Position - Wave (c) of ‘y’
Direction - Bearish for the start of wave (C)
Details - Price starting to turn down after completing the sub-waves of wave Y of (B). The bearish impulse for wave 1 is expected with invalidation at 87.63.
Crude oil buyers are finding resistance just below $88 as the commodity is turning down a little. Is this a matter of another pullback before the rally as we have seen since the turn of the year 2024 or the corrective rally that started in December 2023 has closed and the preceding bearish trend between September and December 2023 is about to begin? Large moves often start with small moves. Is a sentiment shift looming on crude oil? In today’s blog post, we will look to analyze crude oil's long and medium-term price action to forecast what we will be expecting next.
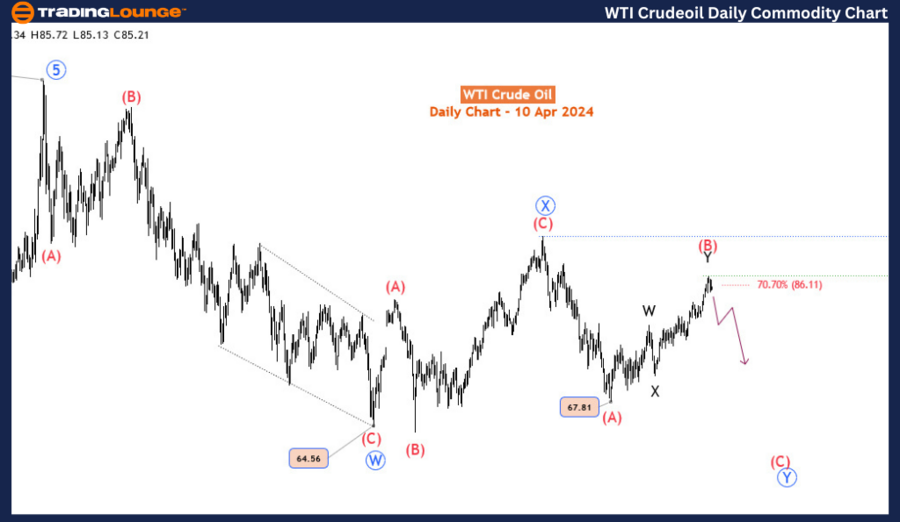
WTI Crudeoil Day Chart Analysis
On the daily time frame, a long-term bearish correction started in March 2022 when the commodity exchanged for $130.9. This was expected to correct the bullish trend, between April 2020 and March 2022, that saw crude oil ‘rose from the dead’ after being battered by the global Covid lockdowns. This correction has now lasted for over two years. It’s very likely to see the commodity drop back to the pre-covid prices between $64 and $50. Looking at the correction from the prism of the Elliott wave theory, as the daily chart shows, the decline from March 2022 ($130.9) to March 2023 ($64.5) completed a 3-wave. The response from $64.5 to September 2023 ($95) also completed a 3-wave. This suggests that the decline from the $130.9 high could be evolving in a double three (zigzag) pattern. Thus, we labelled them as wave ‘W’-’X’-’Y‘ (circled in blue). While waves ‘W’ and ‘X’ have been completed, wave ‘Y’ is still evolving from September 2023 ($95) and by projection could continue lower to $54.5-$46.8. Another thing to note is that wave ‘Y’ is also evolving into a double three (zigzag) labelled wave (A)-(B)-(C). The current rally from December is wave (B) and is expected to end below $95 before sellers take over for wave (Y) below $67.8 low.
TradingLounge Commodities WTI Crudeoil Elliott Wave Analysis
WTI Crudeoil 4-Hour Chart Analysis
Wave (B) is completing a double 3 pattern as well. On the H4 time frame, wave Y of (B) could have ended or may rally toward the $90 major level if $87.63 is breached upside. In all of these, picking the top is not advised. To ascertain that wave (B) has ended, we should see an impulse or a sharp 3-wave dip toward 60. Otherwise, small dips will lead to a higher leg toward $90.
This detailed Elliott Wave analysis of WTI crude oil highlights a bearish outlook, with anticipation of price declines in the near term. For traders and investors, this analysis underscores the importance of closely monitoring price movements and adjusting strategies accordingly to navigate the volatile energy market.
Technical Analyst: Sanmi Adeagbo
Source: visit Tradinglounge.com and learn From the Experts Join TradingLounge Here
See Previous: Wheat Commodity
TradingLounge Once Off SPECIAL DEAL: Here > 1 month Get 3 months.
TradingLounge's Free Week Extravaganza!
April 14 – 21: Unlock the Doors to Trading Excellence — Absolutely FREE