ADA/USD (Cardano) Elliott Wave Analysis & Trading Strategy
ADA/USD Daily Chart Analysis
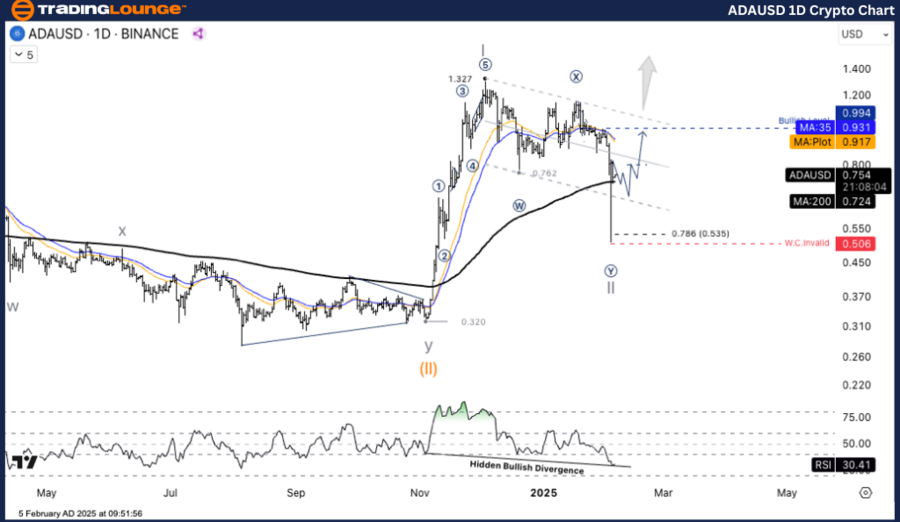
ADAUSD Elliott Wave Technical Analysis
Function: Counter Trend
Mode: Corrective
Structure: Double Corrective
Position: Wave ((Y))
Next Higher Degree Direction: Bullish if price remains above 0.506
Invalidation Level: 0.506
ADA/USD Technical Details
Cardano (ADAUSD) is currently forming a Corrective Wave II, suggesting a temporary pullback before a potential uptrend continuation. The structure follows a double corrective pattern (W)-(X)-(Y), with key Fibonacci retracement support near 0.535 (0.786 Fib Level). The long-term bullish outlook remains intact as long as price does not break below 0.506.
ADA/USD Daily Chart Trading Strategy
Buy Strategy (Long Position)
- Enter a long position if the price reverses from the 0.535 support level.
- Target the 1.327 zone for potential profit-taking.
Risk Management
ADA/USD (Cardano) Elliott Wave Analysis - TradingLounge 4H
ADA/USD 4-Hour Chart Analysis
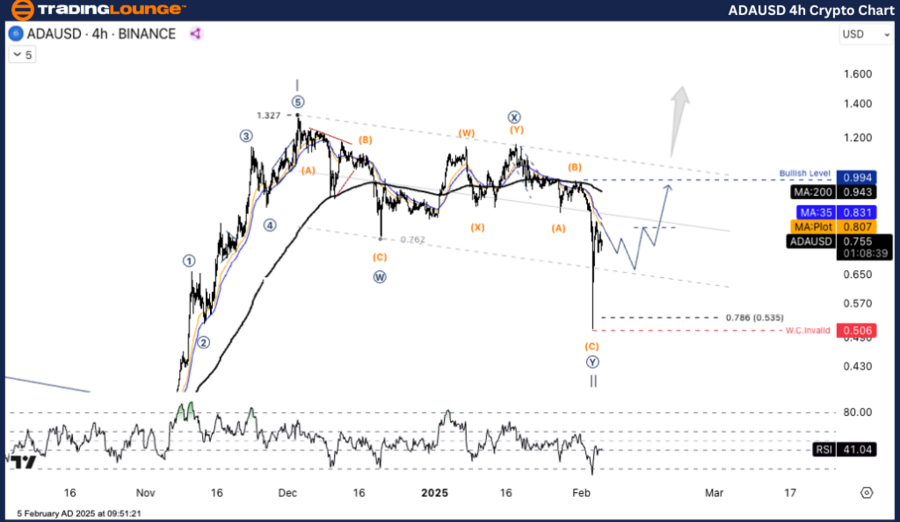
ADAUSD Elliott Wave Technical Overview
Function: Counter Trend
Mode: Corrective
Structure: Double Corrective
Position: Wave ((Y))
Next Higher Degree Direction: Bullish if price remains above 0.506
Invalidation Level: 0.506
ADA/USD Technical Details
Cardano (ADAUSD) remains within Corrective Wave II, forming a double corrective pattern (W)-(X)-(Y). The key support level is near 0.535 (0.786 Fibonacci Retracement), where a potential price reversal may occur. The bullish trend remains intact unless ADAUSD breaks below 0.506.
ADA/USD 4-Hour Chart Trading Strategy
Buy Strategy (Long Position)
- Entry Point: If price finds support at 0.535, consider a long position.
- Profit Target: Look to take profits around the 1.327 resistance level.
Risk Management
Technical Analyst: Kittiampon Somboonsod
Source: visit Tradinglounge.com and learn From the Experts Join TradingLounge Here
Previous: THETAUSD Elliott Wave Technical Analysis
VALUE Offer - Buy 1 Month & Get 3 Months!Click here
Access 7 Analysts Over 200 Markets Covered. Chat Room With Support
Conclusion
Cardano (ADAUSD) is in a corrective phase, but its long-term bullish trend remains intact as long as it stays above 0.506. Traders can consider long positions from the 0.535 support level, aiming for profits near 1.327, while maintaining strict risk management to avoid invalid setups.
For more Elliott Wave insights and market updates, keep monitoring ADAUSD price action. 🚀