Hang Seng Index Elliott Wave Analysis – Trading Lounge Day Chart
Hang Seng Index Elliott Wave Technical Analysis
Function: Counter Trend
Mode: Corrective
Structure: Gray Wave 2
Position: Orange Wave 3
Direction of Next Higher Degrees: Gray Wave 3
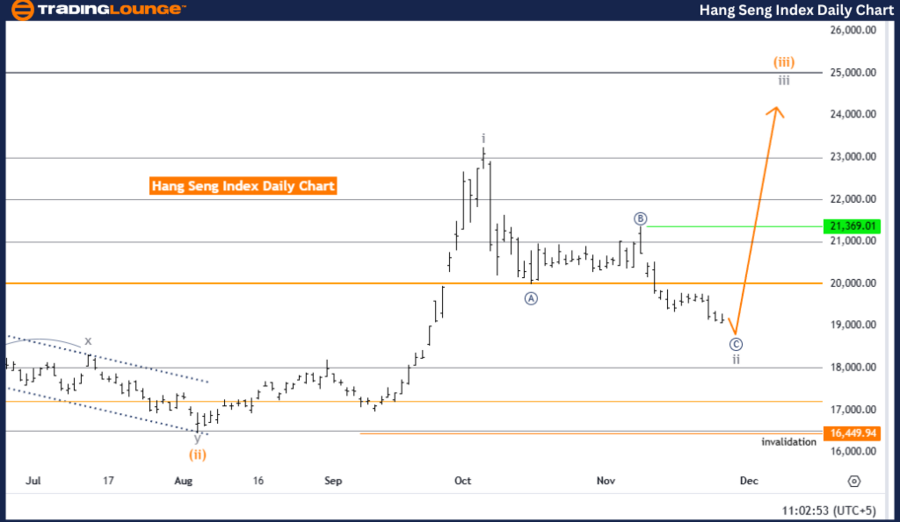
Details: Gray wave 1 has likely completed, and gray wave 2 is actively progressing.
Wave Cancel Invalid Level: 16,449.94
This analysis applies the Elliott Wave theory to evaluate the Hang Seng Index (HSI) on a daily chart. Currently, the market is experiencing a counter-trend phase, representing a temporary reversal within a larger upward trend. The primary focus is on gray wave 2, which follows the completion of gray wave 1. This corrective phase will likely precede the next impulsive wave's emergence.
The current phase involves orange wave 3, a smaller wave within the broader gray wave 2 corrective structure. This counter-trend stage remains ongoing, with further development anticipated before transitioning into gray wave 3, signaling the resumption of the upward impulsive movement.
Key Threshold: Invalidation Level
The invalidation level is set at 16,449.94. Should the index fall to this level, the existing wave count and projections would be invalidated. This serves as a critical reference point for traders to confirm the ongoing corrective phase and adjust risk management strategies accordingly.
Conclusion
Elliott Wave analysis indicates that the Hang Seng Index is in the midst of a counter-trend phase, with gray wave 2 actively unfolding. The completion of gray wave 1 confirmed the start of this corrective movement, while orange wave 3 reflects the ongoing activity within the phase. As long as the index stays above the invalidation level of 16,449.94, the counter-trend outlook holds. Further corrective movement is expected before the impulsive phase of gray wave 3 begins.
Hang Seng Index Elliott Wave Analysis – Trading Lounge Weekly Chart
Hang Seng Index Elliott Wave Technical Analysis
Function: Counter Trend
Mode: Corrective
Structure: Gray Wave 2
Position: Orange Wave 3
Direction of Next Higher Degrees: Gray Wave 3
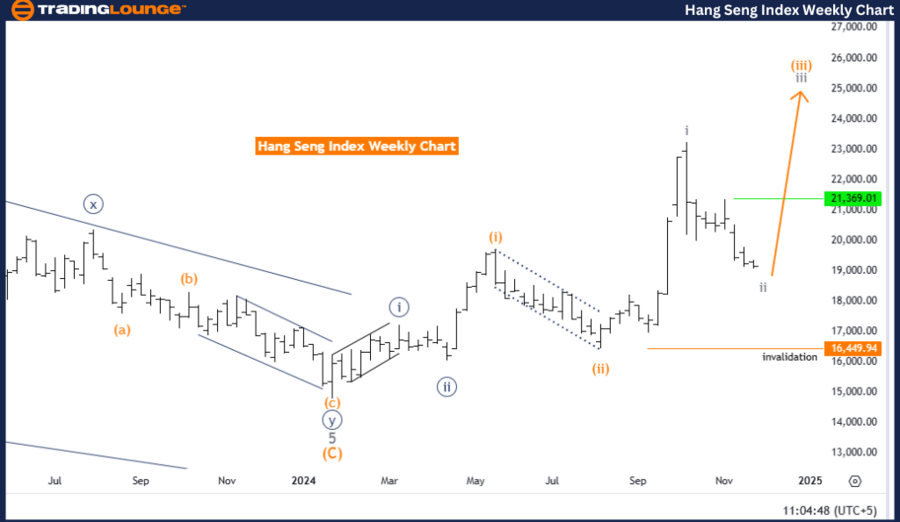
Details: Gray wave 1 appears to have completed, with gray wave 2 currently evolving.
Wave Cancel Invalid Level: 16,449.94
Using Elliott Wave theory, this weekly chart analysis highlights the Hang Seng Index's corrective phase, a temporary reversal within the broader upward trend. The main structure under observation is gray wave 2, which commenced after the completion of gray wave 1. This phase indicates the continuation of the correction before the next impulsive wave arises.
At present, the index is in orange wave 3, a minor wave nested within the broader gray wave 2 corrective structure. This stage signifies ongoing counter-trend movement, with further progression anticipated before the transition to gray wave 3, resuming the upward impulsive trend.
Key Threshold: Invalidation Level
The invalidation level is at 16,449.94. If this level is breached, the current Elliott Wave count and analysis will be invalidated. This key threshold is vital for traders to validate the wave structure and manage their risk effectively.
Technical Analyst: Malik Awais
Source: visit Tradinglounge.com and learn From the Experts Join TradingLounge Here
Previous: S&P 500 Elliott Wave Technical Analysis
VALUE Offer - Buy 1 Month & Get 3 Months!Click here
Access 7 Analysts Over 200 Markets Covered. Chat Room With Support
Conclusion
Elliott Wave analysis suggests the Hang Seng Index is in a corrective phase, with gray wave 2 developing actively. The conclusion of gray wave 1 marked the beginning of this counter-trend phase, while orange wave 3 represents the current activity. As long as the index remains above the invalidation level of 16,449.94, the counter-trend phase remains intact. Further corrective movement is expected before the impulsive phase associated with gray wave 3 begins.