Swiss Market Index Elliott Wave Analysis Trading Lounge Day Chart
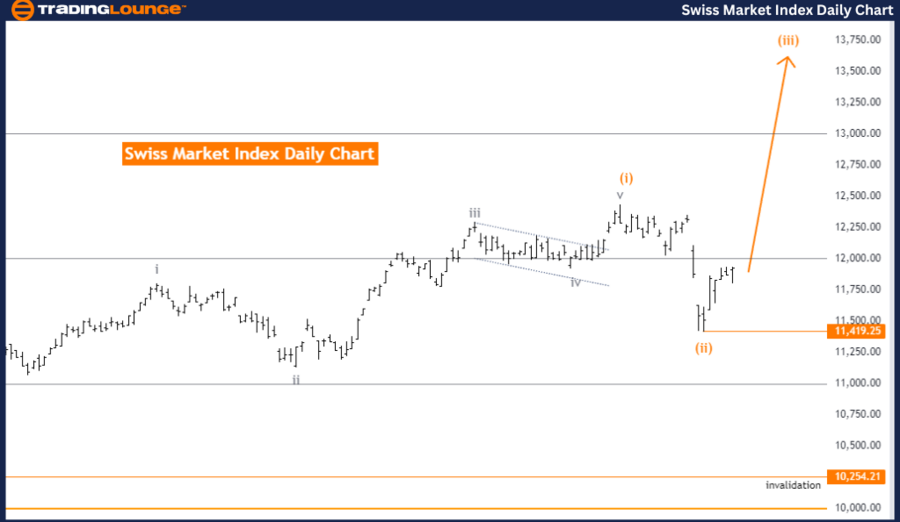
Swiss Market Index Daily Chart Analysis
Swiss Market Index Elliott Wave Technical Analysis
Function: Trend
Mode: Impulsive
Structure: Orange Wave 3
Position: Navy Blue Wave 3
Direction Next Higher Degrees: Orange Wave 3 (started)
Details: Orange Wave 2 of 3 appears complete, with Orange Wave 3 now in progress.
Wave Cancel Invalid Level: 10254.21
The Swiss Market Index (SMI) is currently exhibiting a strong trend with an impulsive structure, as highlighted by the ongoing Elliott Wave analysis. The market is advancing within Orange Wave 3, which follows the completion of Orange Wave 2. This shift marks the end of the corrective phase associated with Wave 2, signaling the onset of the more dynamic upward movement characteristic of Orange Wave 3.
At present, the SMI is positioned within Navy Blue Wave 3, embedded within the larger Orange Wave 3. This positioning reflects significant upward momentum, consistent with the impulsive nature of Wave 3 in Elliott Wave theory, typically the most powerful and extended wave. As a result, the current bullish movement is expected to persist.
The focus remains on the continuation of Orange Wave 3, which has already commenced. This suggests that the market is likely to maintain its upward trajectory, with the potential for reaching new highs as the wave progresses.
A critical aspect of this analysis is the wave cancellation invalid level, established at 10254.21. This level serves as a crucial threshold for validating the current wave structure. If the SMI drops below this level, it would invalidate the current wave count, indicating a potential reversal or significant correction.
In summary: The SMI is in an impulsive trend mode within Orange Wave 3, following the completion of Orange Wave 2. The index is currently in Navy Blue Wave 3, with expectations of continued upward momentum. The wave cancel invalid level at 10254.21 is key for confirming the ongoing bullish trend.
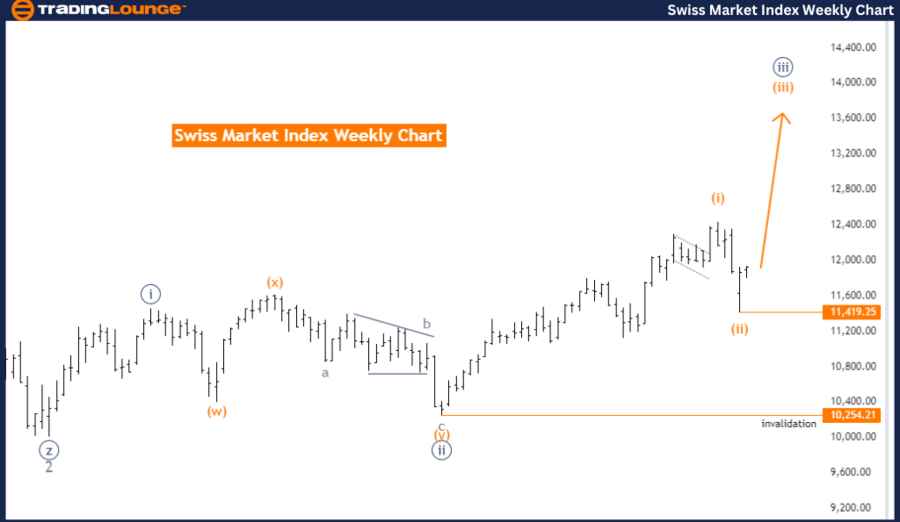
Swiss Market Index Elliott Wave Analysis Trading Lounge Weekly Chart
Swiss Market Index Elliott Wave Technical Analysis
Function: Trend
Mode: Impulsive
Structure: Orange Wave 3
Position: Navy Blue Wave 3
Direction Next Higher Degrees: Orange Wave 3 (started)
Details: Orange Wave 2 of 3 appears complete, with Orange Wave 3 now in progress.
Wave Cancel Invalid Level: 10254.21
The Swiss Market Index (SMI) continues to follow a strong trend within the Elliott Wave framework, characterized by an impulsive movement. The ongoing analysis indicates that the market is within Orange Wave 3, following the completion of Orange Wave 2. This suggests that the corrective phase associated with Wave 2 has concluded, and the market is advancing within the more aggressive, upward-trending Orange Wave 3.
Currently, the SMI is situated in Navy Blue Wave 3, within the larger structure of Orange Wave 3. This positioning reflects significant upward momentum as the index moves through the impulsive Wave 3. In Elliott Wave theory, Wave 3 is typically the strongest and most extended phase, indicating a continuation of the bullish trend.
The analysis forecasts the continuation of Orange Wave 3 at the next higher degree, indicating that the upward trend is expected to persist. With Orange Wave 3 already underway, the market is anticipated to continue rising, with the potential to reach new highs as this wave unfolds.
A key component of this analysis is the wave cancel invalid level, set at 10254.21. This level is essential for validating the current wave structure. Should the SMI fall below this level, it would invalidate the current wave count, suggesting a potential reversal or significant market correction.
In summary: The SMI is in a trend mode with an impulsive structure within Orange Wave 3, following the completion of Orange Wave 2. The index is currently in Navy Blue Wave 3, with expectations of continued upward momentum. The wave cancel invalid level at 10254.21 is crucial for confirming the ongoing bullish trend.
Technical Analyst: Malik Awais
Source: visit Tradinglounge.com and learn From the Experts Join TradingLounge Here
See previous: NIKKEI 225 Index Elliott Wave Technical Analysis
Special Trial Offer - 0.76 Cents a Day for 3 Months! Click here
Access 7 Analysts Over 170 Markets Covered. Chat Room With Support