17Jun

ASX MINERAL RESOURCES LIMITED Elliott Wave Technical Analysis: MIN Set for Bullish Fifth‑Wave Rally with Key Invalidation Levels in Place

ASX: MINERAL RESOURCES LIMITED - MIN Elliott Wave Forecast & Technical Analysis by TradingLounge

Our latest Elliott Wave analysis for MINERAL RESOURCES LIMITED (ASX: MIN) highlights a favorable bullish outlook. The recent completion of a Wave 4 correction sets the stage for an impulsive Wave 5 upward movement. This review defines projected price targets and essential invalidation levels for technical traders.


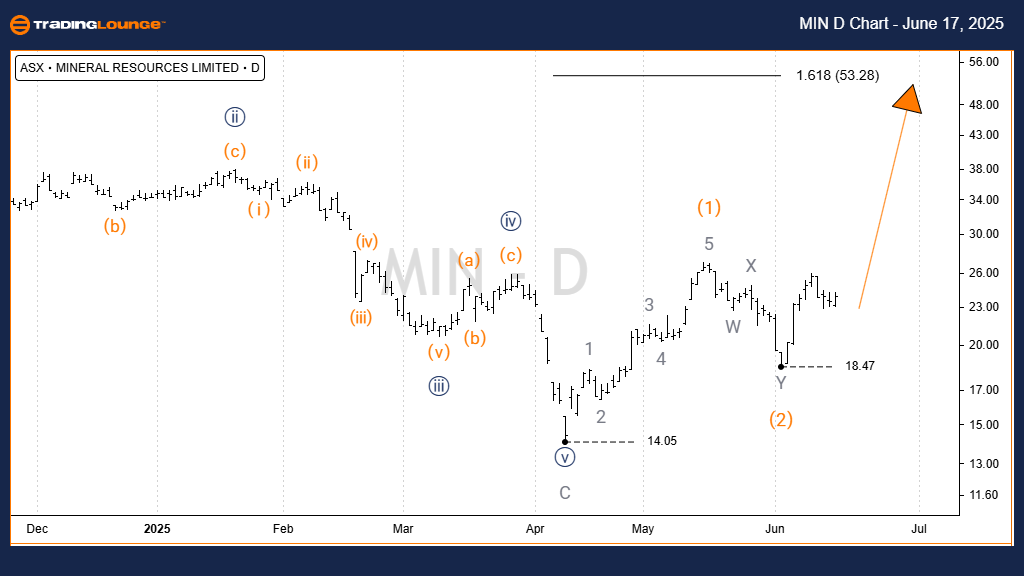
ASX: MINERAL RESOURCES LIMITED 1D Chart Analysis Overview (Semilog Scale)

Function: Primary trend (Intermediate degree, orange)

Mode: Motive

Structure: Impulse

Current Wave Count: Wave 3 (orange) within Wave 5 (navy)

Technical Breakdown:

The corrective phase has ended at the $14.05 price level.

A new impulsive structure is now anticipated to lead the stock higher.

Immediate upside targets are forecasted between $50.00 and $80.00.

The bullish scenario is considered valid only if prices remain above $14.05.

Key Invalidation Level: $14.05

MIN-d-asx-chart-1706...


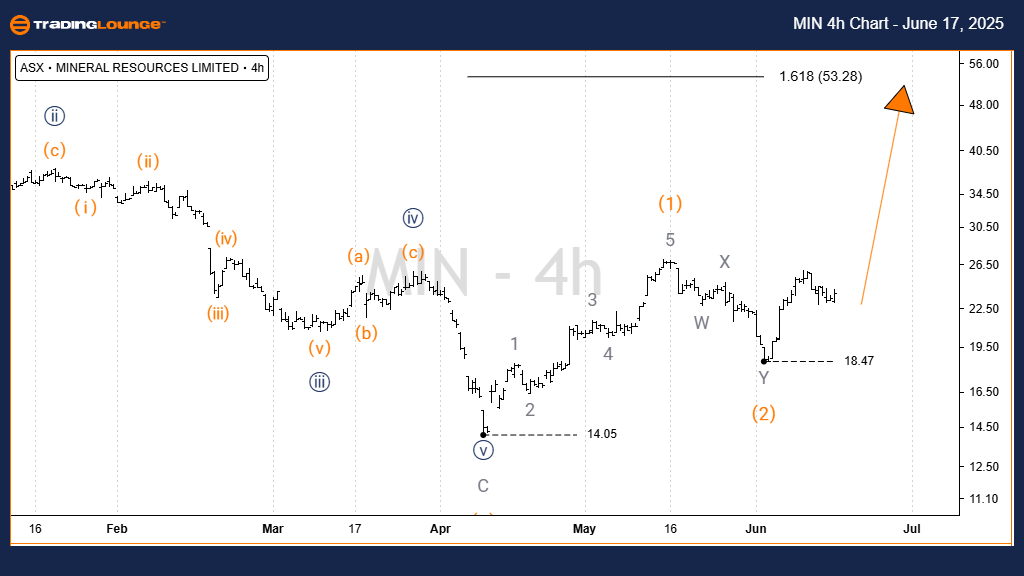
 ASX: MINERAL RESOURCES LIMITED 4-Hour Chart Technical View

Function: Primary trend (Intermediate degree, orange)

Mode: Motiv

Structure: Impulse

Current Wave Count: Wave 3 (orange)

Technical Breakdown:

Wave 1 (orange) successfully completed at $14.05, confirmed as a five-wave structure.

Wave 2 (orange) followed with a Double Zigzag corrective pattern, ending at $18.47.

The chart now suggests Wave 3 (orange) is in motion, aiming for the $53.28 target.

Key Invalidation Level: $18.47
(Bullish scenario remains intact only if price sustains above this point)

Technical Analyst: Hua (Shane) Cuong, CEWA-M (Master’s Designation).

Source: Visit Tradinglounge.com and learn from the Experts. Join TradingLounge Here 

See Previous: BHP GROUP LIMITED - BHP Elliott Wave Technical Analysis

VALUE Offer - $1 for 2 Weeks then $29 a month!Click here

Access 7 Analysts Over 200 Markets Covered. Chat Room With Support

MIN-4h-asx-chart-170...


Conclusion

This Elliott Wave technical forecast for ASX: MINERAL RESOURCES LIMITED (MIN) delivers a structured analysis of potential price movement. It emphasizes key support and resistance levels, reinforcing the wave count accuracy. This helps traders navigate the market with greater confidence and clarity, using an evidence-based strategy.

Related

Unlocking ASX Trading Success: BLOCK INC. - SQ2 Stock Analysis & Elliott Wave Technical Forecast

Unlocking ASX Trading Success: BLOCK INC. - SQ2 Stock Analysis & Elliott Wave Technical Forecast

Our comprehensive analysis provides an insightful look into Block Inc. - SQ2 using Elliott Wave theo...

Read More >
Elliott Wave Analysis: S&P 500, NASDAQ 100, RUT, DAX 40, FTSE 100, ASX200 Trading Strategies

Elliott Wave Analysis: S&P 500, NASDAQ 100, RUT, DAX 40, FTSE 100, ASX200 Trading Strategies

In this Stock Market Report covering S&P 500, NASDAQ 100, RUSSELL 2000, DAX 40, FTSE 100, and ASX 20...

Read More >
ASX FORTESCUE LTD Elliott Wave Analysis: FMG Fortescue Metals Stock Forecast, Key Trading Strategies, Wave Count Insights

ASX FORTESCUE LTD Elliott Wave Analysis: FMG Fortescue Metals Stock Forecast, Key Trading Strategies, Wave Count Insights

Elliott Wave analysis explores the current wave structure of ASX: FMG (Fortescue Metals Group), high...

Read More >
Understanding of ChainLink Crypto Price News through LINKUSD Elliott Wave Technical Analysis

Understanding of ChainLink Crypto Price News through LINKUSD Elliott Wave Technical Analysis

Gain a thorough understanding of ChainLink (LINKUSD) through Elliott Wave analysis. This guide provi...

Read More >
Newmont Corporation (ASX:NEM) Elliott Wave Analysis Reveals Bullish Wave 3 Progression with $100 Target and Key Price Levels

Newmont Corporation (ASX:NEM) Elliott Wave Analysis Reveals Bullish Wave 3 Progression with $100 Target and Key Price Levels

This analysis provides an in-depth Elliott Wave forecast for Newmont Corporation (ASX:NEM), highligh...

Read More >
AAVE / U.S. dollar(AAVEUSD) Elliott Wave Technical Analysis 28 November 23

AAVE / U.S. dollar(AAVEUSD) Elliott Wave Technical Analysis 28 November 23

AAVE / U.S. dollar(AAVEUSD) Elliott Wave Analysis TradingLounge Daily Chart and 4H Chart dated 28 No...

Read More >

$1 for 2 Weeks

then $29 a month!

What a Special Offer!

Trade Recommendations

Unleash the power of deversified trading with our comprehensive portfolio, covering 250+ markets:

  • Stock Trades
  • Crypto Trades
  • Forex Trades
  • Commodity Trades
Elliott Wave Analysis

Gain a competitive edge with expert insights and AI-powered Elliott Wave charting into:

  • Global Indices
  • US Stocks & ASX Stocks
  • Forex & Crypto
  • Commodities
Top-Notch Trading Tools

Equip yourself with the tools of success:

  • Real-time Chat rooms
  • Elliott Wave Algorithm
  • Portfolio tools
  • TradingLevels
  • Screener
  • Trading Game
7 Elliott Wave Analysts

Stay ahead of the market with daily charts and insightful videos
Your secret to strategic trading!

JOIN HERE


Welcome to TradingLounge (ASIC A.R.No. 321187), specialists in trades, trading education and technical analysis, covering stocks, indices, commodities, forex and cryptocurrencies.

When you join TradingLounge you have access to everything we offer, including trade tools, educational content and a social platform to chat with like-minded investors.

Read more

@Copyright 2024 by tradinglounge.com

Contact Us

Australian no: 02 4787 6020

International no: +61 (2) 47876020

Pay with:

Find us on