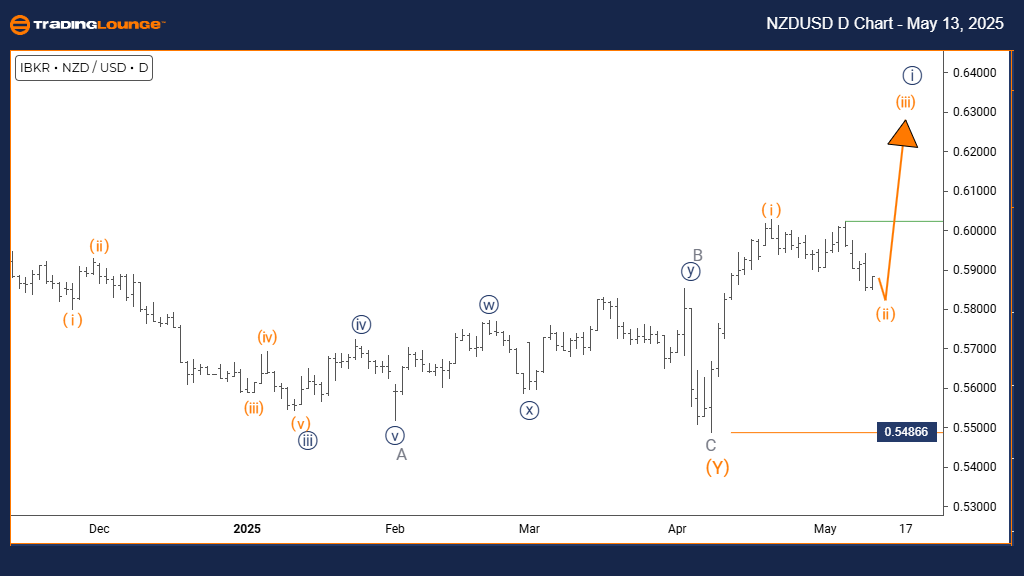
New Zealand Dollar / U.S. Dollar (NZDUSD) Elliott Wave Analysis | Trading Lounge Daily Chart
NZDUSD Elliott Wave Technical Forecast
FUNCTION: Counter-Trend
MODE: Corrective
STRUCTURE: Orange Wave 2
POSITION: Navy Blue Wave 1
DIRECTION NEXT HIGHER DEGREES: Orange Wave 3
DETAILS: Orange Wave 1 is likely complete; Orange Wave 2 is in progress.
WAVE INVALIDATION LEVEL: 0.54866
The NZDUSD daily chart outlines a corrective wave within a broader bearish Elliott Wave cycle. Currently, the price is moving in a counter-trend retracement—labeled as orange wave 2—which follows the completed downward orange wave 1. This phase often signals temporary upward or sideways price action ahead of a potential drop in orange wave 3.
Technical indicators suggest that orange wave 1 has ended, and the pair is in a classic corrective formation for wave 2. Once this wave concludes, the market could resume its bearish trend into orange wave 3. The key invalidation point is set at 0.54866—a break above this would question the bearish scenario and possibly imply a more complex correction or trend reversal. Until then, the bearish bias remains valid.
This analysis helps traders position themselves during a temporary pullback phase. Orange wave 2 provides short-term relief in a downward structure, but the setup favors continued selling once the correction ends. Monitoring price near the invalidation level is crucial for validating or rejecting the current wave setup.
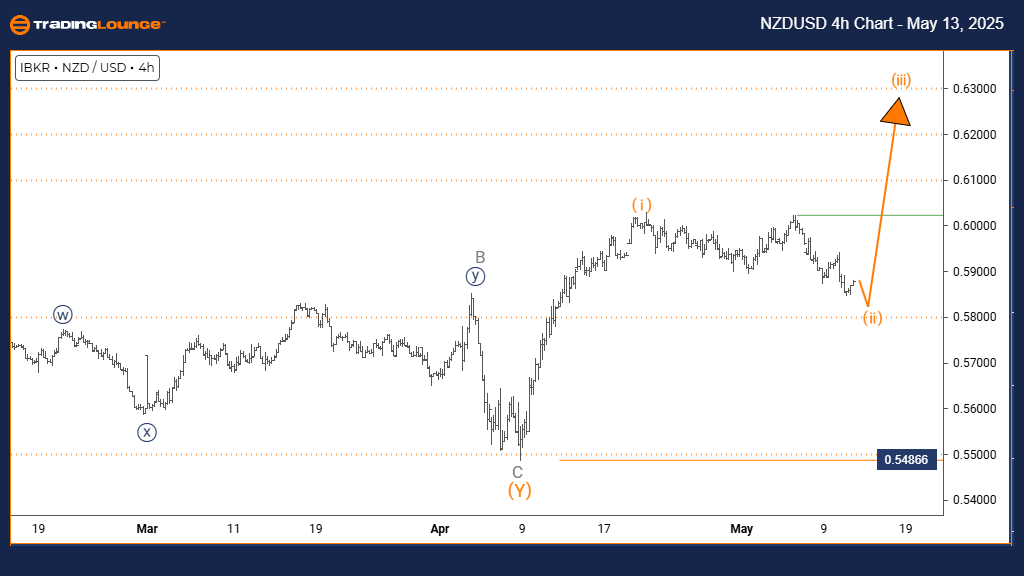
New Zealand Dollar / U.S. Dollar (NZDUSD) Elliott Wave Analysis | Trading Lounge 4-Hour Chart
NZDUSD Elliott Wave Technical Forecast
FUNCTION: Counter-Trend
MODE: Corrective
STRUCTURE: Orange Wave 2
POSITION: Navy Blue Wave 1
DIRECTION NEXT HIGHER DEGREES: Orange Wave 3
DETAILS: Orange Wave 1 likely concluded; Orange Wave 2 is developing.
WAVE INVALIDATION LEVEL: 0.54866
The 4-hour NZDUSD chart presents a clear counter-trend correction unfolding within a larger downtrend. With orange wave 1 completed, the pair is now developing orange wave 2, suggesting a short-term retracement before the possible continuation to the downside via orange wave 3.
This wave count supports the view that the market is pausing before another leg down. Orange wave 2, part of a corrective sequence, is typical in this context. If the pair stays below the critical resistance at 0.54866, the expectation remains bearish. However, a breakout above this level could imply a more complex correction or even a trend reversal.
Traders should closely monitor this phase. When orange wave 2 nears its completion, it may provide a setup for short trade entries in anticipation of orange wave 3. This structure outlines a clear bearish outlook while emphasizing the importance of the invalidation level for trading decisions.
Technical Analyst: Malik Awais
Source: Visit Tradinglounge.com and learn from the Experts. Join TradingLounge Here
Previous: AUDUSD Elliott Wave Technical Analysis
VALUE Offer - Buy 1 Month & Get 3 Months!Click here
Access 7 Analysts Over 200 Markets Covered. Chat Room With Support