Lululemon Athletica Inc. (LULU) Elliott Wave Analysis – Current Trend and Future Outlook

This Elliott Wave analysis for Lululemon Athletica Inc. (LULU) evaluates the present trend structure and offers insights into possible future movements based on wave positioning. We will review both the daily and 1-hour charts to determine the stock's outlook.

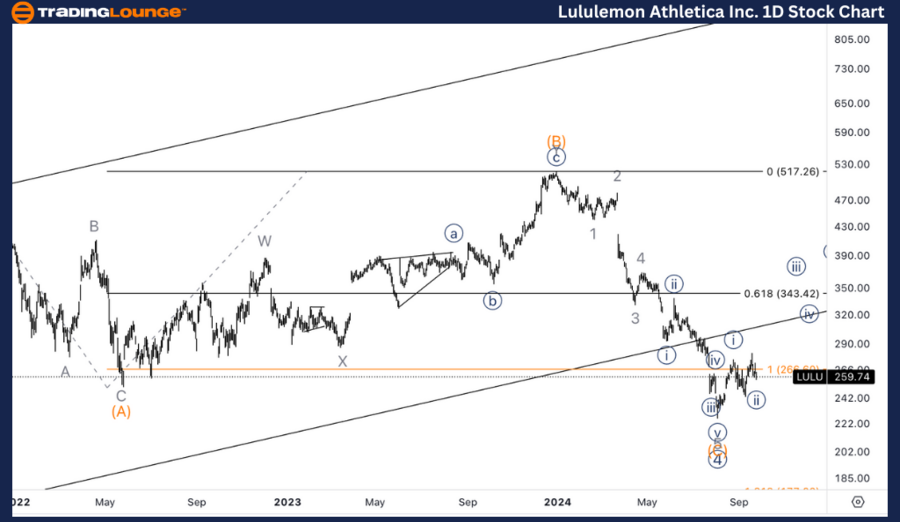
TradingLounge US Stock Lululemon Athletica Inc Analysis – Day Chart

Lululemon Athletica Inc. (LULU) Daily Chart Analysis

LULU Elliott Wave Technical Analysis

FUNCTION: Trend

MODE: Impulsive

STRUCTURE: Motive

POSITION: Wave (1)

DIRECTION: Upside in (1)

DETAILS: A potential bottom seems to be in place for Primary Wave 4, signaling a resumption of an upward movement. The stock has found support at the $200 level, aligned with Trading Level 2 (TL2).

LULU Technical Analysis – Daily Chart

On the daily chart, Lululemon is progressing within Wave (1) of a new impulsive uptrend, likely following the completion of Primary Wave 4. The stock has found solid support around $200, which is near Trading Level 2 (TL2), indicating a possible bottom formation.

With this support intact, we expect a continuation of the bullish trend as Wave (1) advances. Traders should look for confirmation of this trend by observing price movements above key resistance levels, signaling the next leg higher in this bullish cycle.

Lululemon-athletica-...


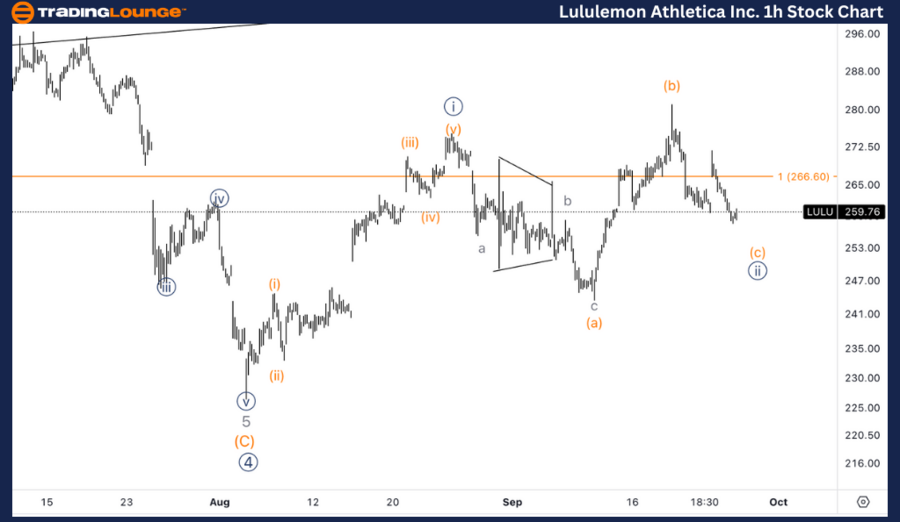
TradingLounge US Stock LULU Analysis 1-Hour Chart

Lululemon Athletica Inc. (LULU) 1-Hour Chart

LULU Elliott Wave Technical Analysis

FUNCTION: Trend

MODE: Impulsive

STRUCTURE: Motive

POSITION: Wave 1

DIRECTION: Bottom in Wave {ii} of 1

DETAILS: We are currently observing a three-wave move down into Wave {ii}, with an expectation of a bullish resumption. The initial decline from Wave {i} appears to be part of a corrective three-wave structure, suggesting another leg higher is likely.

LULU Stock Technical Analysis – 1H Chart

On the 1-hour chart, Lululemon is within Wave 1 of the larger daily structure. Currently, we are witnessing a correction in Wave {ii}. The decline from the Wave {i} top seems to follow a three-wave corrective pattern, indicating that Wave {ii} is close to completing.

Once this correction concludes, the stock is expected to resume its upward trend, signaling the beginning of Wave {iii}. Given the corrective nature of the recent pullback, the next upward movement could present a strong bullish impulse for Lululemon.

Technical Analyst: Alessio Barretta

Source: visit Tradinglounge.com and learn From the Experts Join TradingLounge Here 

See Previous: Dell Technologies Inc. (DELL) Elliott Wave Technical Analysis

VALUE Offer - Buy 1 Month & Get 3 Months!Click here

Access 7 Analysts Over 200 Markets Covered. Chat Room With Support

Lululemon-athletica-...

Related

NASDAQ Stock Market Update: Key Insights on AAPL, TSLA, AMZN, and More as Earnings Week Approaches

NASDAQ Stock Market Update: Key Insights on AAPL, TSLA, AMZN, and More as Earnings Week Approaches

The text provides an Elliott Wave analysis of the NASDAQ stock market, focusing on major indices lik...

Read More >
BTCUSD Elliott Wave Technical Analysis to Understand Bitcoin’s Current Price Action and BTC Forecast News Today

BTCUSD Elliott Wave Technical Analysis to Understand Bitcoin’s Current Price Action and BTC Forecast News Today

Dive into an in-depth BTCUSD Elliott Wave analysis to understand Bitcoin’s current price action and...

Read More >
Our technical analysis of the DAX (Germany) Index highlights Trading Strategies | DAX Elliott Wave Analysis

Our technical analysis of the DAX (Germany) Index highlights Trading Strategies | DAX Elliott Wave Analysis

Discover a detailed DAX Elliott Wave analysis that delves into the current market trends and forecas...

Read More >
SPOT Elliott Wave technical analysis & SPOT Price Predictions | Spotify Technology S.A. stock Analysis

SPOT Elliott Wave technical analysis & SPOT Price Predictions | Spotify Technology S.A. stock Analysis

Our latest Spotify Technology S.A. (SPOT) using Elliott Wave Theory provides detailed insights into ...

Read More >
Polkadot Forecast and DOTUSD Elliott Wave Analysis, Confirming Bullish Breakout and Trend Continuation from Fibonacci Zone

Polkadot Forecast and DOTUSD Elliott Wave Analysis, Confirming Bullish Breakout and Trend Continuation from Fibonacci Zone

Polkadot (DOT) is showing bullish momentum, entering wave 3 after a Zigzag correction. Elliott Wave ...

Read More >

$1 for 2 Weeks

then $29 a month!

What a Special Offer!

Trade Recommendations

Unleash the power of deversified trading with our comprehensive portfolio, covering 250+ markets:

  • Stock Trades
  • Crypto Trades
  • Forex Trades
  • Commodity Trades
Elliott Wave Analysis

Gain a competitive edge with expert insights and AI-powered Elliott Wave charting into:

  • Global Indices
  • US Stocks & ASX Stocks
  • Forex & Crypto
  • Commodities
Top-Notch Trading Tools

Equip yourself with the tools of success:

  • Real-time Chat rooms
  • Elliott Wave Algorithm
  • Portfolio tools
  • TradingLevels
  • Screener
  • Trading Game
7 Elliott Wave Analysts

Stay ahead of the market with daily charts and insightful videos
Your secret to strategic trading!

JOIN HERE


Welcome to TradingLounge (ASIC A.R.No. 321187), specialists in trades, trading education and technical analysis, covering stocks, indices, commodities, forex and cryptocurrencies.

When you join TradingLounge you have access to everything we offer, including trade tools, educational content and a social platform to chat with like-minded investors.

Read more

@Copyright 2024 by tradinglounge.com

Contact Us

Australian no: 02 4787 6020

International no: +61 (2) 47876020

Pay with:

Find us on