10Feb

S&P 500 Elliott Wave Technical Analysis: Market Trends, Key Support Levels, Best Stocks to Buy, and Investment Insights for Smart Trading

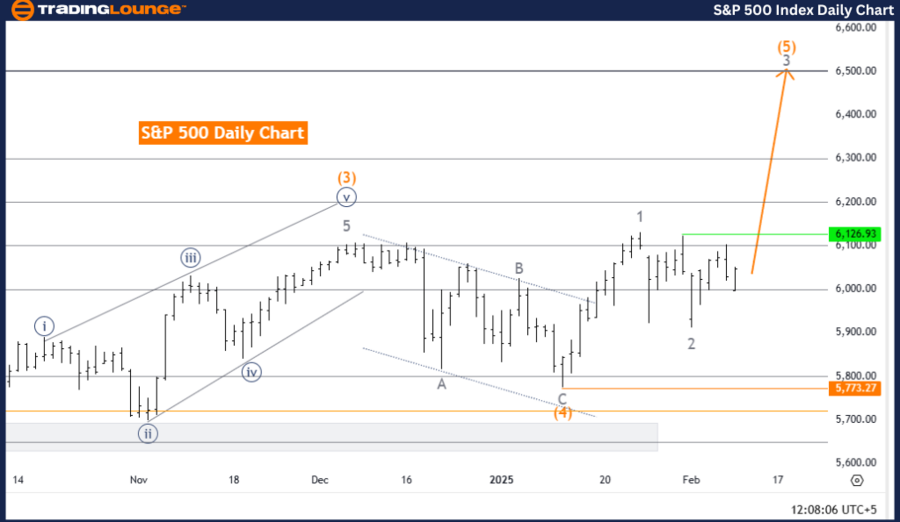
S&P 500 Elliott Wave Analysis – TradingLounge Day Chart

S&P 500 Elliott Wave Technical Analysis

Function: Bullish Trend

Mode: Impulsive

Structure: Gray Wave 3

Position: Orange Wave 5

Direction Next Higher Degrees: Gray Wave 3 (Started)

Details: Gray Wave 2 appears to have completed, and Gray Wave 3 is currently unfolding.

Wave Cancellation Invalidation Level: 5,773.27

S&P 500 Index Analysis Overview

The S&P 500 Elliott Wave Analysis for the daily chart confirms a bullish trend, with the market in impulsive mode, indicating strong upward momentum.

The current wave structure identifies Gray Wave 3, which is developing within the larger Orange Wave 5. This highlights a significant upside phase, with the potential for further gains as Gray Wave 3 progresses.

Wave Progression and Key Levels

  • Gray Wave 2 has likely completed, marking the end of the correction phase.

  • Gray Wave 3 is now in motion, indicating a continuation of the bullish trend.
  • The higher degree wave movement supports a sustained uptrend.

A critical price level to monitor is the Wave Cancellation Invalidation Level at 5,773.27. A drop below this threshold would invalidate the current wave count, potentially altering the bullish outlook. Traders should carefully observe price action around this level for trend confirmation.

Summary

The S&P 500 Daily Chart Analysis confirms an impulsive bullish trend, with Gray Wave 3 of Orange Wave 5 leading the market higher. The completion of Gray Wave 2 has set the stage for continued price appreciation.

Key trading considerations include:

  • Monitoring the 5,773.27 level as an invalidation point.
  • Assessing the strength of Gray Wave 3 to determine further upside potential.

If the bullish Elliott Wave structure remains intact, traders can expect a continuation of the uptrend, reinforcing positive market sentiment.

S&P-500-Index-Daily-...


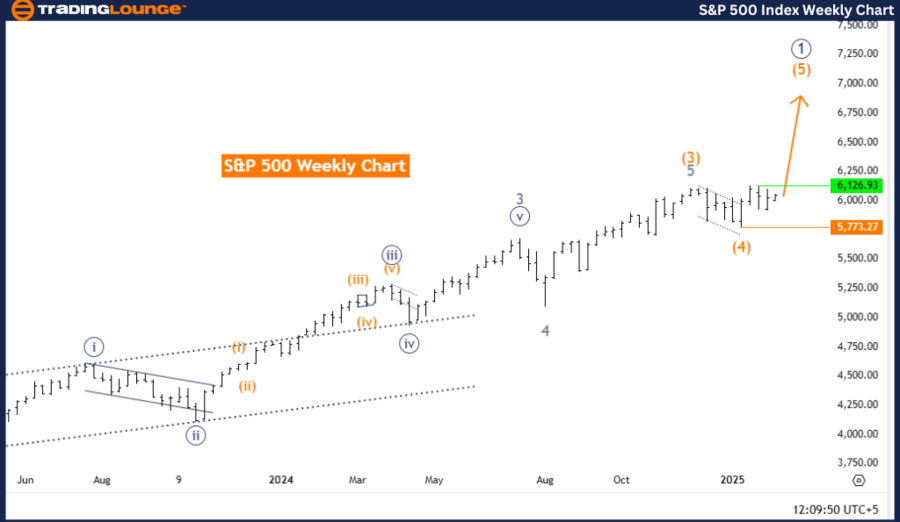
S&P 500 Elliott Wave Analysis – TradingLounge Weekly Chart

S&P 500 Elliott Wave Technical Analysis

Function: Bullish Trend

Mode: Impulsive

Structure: Orange Wave 5

Position: Navy Blue Wave 1

Direction Next Higher Degrees: Orange Wave 5 (Started)

Details: Orange Wave 4 appears to have completed, and Orange Wave 5 is currently unfolding.

Wave Cancellation Invalidation Level: 5,773.27

S&P 500 Index Analysis Overview

The S&P 500 Elliott Wave Analysis for the weekly chart reinforces a bullish outlook, with the market advancing in impulsive mode.

The current wave structure highlights Orange Wave 5, which has started following the completion of Orange Wave 4. This suggests further upside potential, marking the final phase of the impulsive wave sequence.

Additionally, the position within Navy Blue Wave 1 signals the beginning of a strong uptrend, typically associated with rising price action and growing investor confidence.

S&P 500 Index Wave Progression and Key Levels

  • The completion of Orange Wave 4 signifies an exit from the corrective phase, paving the way for continued bullish momentum.

  • Orange Wave 5, often the strongest part of an impulsive cycle, indicates high trading volume and market enthusiasm.
  • The Wave Cancellation Invalidation Level remains at 5,773.27. A price move below this point would invalidate the current wave structure, requiring a revised market outlook.

Summary

The S&P 500 Weekly Chart Analysis confirms a bullish Elliott Wave setup, with Orange Wave 5 within Navy Blue Wave 1 leading the market higher. The completion of Orange Wave 4 sets the stage for further price advances.

Key trading considerations include:

  • Monitoring price action near the invalidation level (5,773.27) to confirm trend strength.
  • Assessing the development of Orange Wave 5 for potential trading opportunities.

If Orange Wave 5 progresses as expected, the bullish trend is likely to continue, reinforcing positive sentiment in the S&P 500 market outlook.

This Elliott Wave analysis offers traders a structured approach to identifying potential price movements and trading strategies based on wave theory principles.

Technical Analyst: Malik Awais

Source: visit Tradinglounge.com and learn From the Experts Join TradingLounge Here 

Previous: Bovespa Index Elliott Wave Technical Analysis

VALUE Offer - Buy 1 Month & Get 3 Months!Click here

Access 7 Analysts Over 200 Markets Covered. Chat Room With Support

S&P-500-Index-Weekly...


Related

VeChain Crypto Price News Today Elliott Wave Technical Analysis: A Comprehensive Analysis VETUSD Pair

VeChain Crypto Price News Today Elliott Wave Technical Analysis: A Comprehensive Analysis VETUSD Pair

In this article, we provide a comprehensive analysis of VeChain (VETUSD) using Elliott Wave theory. ...

Read More >
JAMES HARDIE INDUSTRIES PLC (JHX) Elliott Wave Analysis: ASX Stock Forecast, Price Prediction, Technical Trends & Insights

JAMES HARDIE INDUSTRIES PLC (JHX) Elliott Wave Analysis: ASX Stock Forecast, Price Prediction, Technical Trends & Insights

James Hardie (JHX) Elliott Wave analysis provides a detailed stock forecast for ASX investors. With ...

Read More >
Euro/U.S.Dollar(EURUSD) Forex Elliott Wave Technical Analysis: A Comprehensive Trading Guide

Euro/U.S.Dollar(EURUSD) Forex Elliott Wave Technical Analysis: A Comprehensive Trading Guide

This guide offers a detailed examination of EURUSD Elliott Wave analysis across both daily and 4-hou...

Read More >
Dow Jones Trading Guide: DJI Index Elliott Wave Technical Analysis & DJI Investing Tips | Explore the Best ETFs

Dow Jones Trading Guide: DJI Index Elliott Wave Technical Analysis & DJI Investing Tips | Explore the Best ETFs

Unlock the secrets of Dow Jones trading with an in-depth Elliott Wave analysis. Learn effective stra...

Read More >
Stocks Bullish Trend: NASDAQ, AAPL, AMZN, NVDA, TSLA, GOOGL, META, NFLX, MSFT, Elliott Wave Analysis

Stocks Bullish Trend: NASDAQ, AAPL, AMZN, NVDA, TSLA, GOOGL, META, NFLX, MSFT, Elliott Wave Analysis

NASDAQ Stock Market Elliott Wave Analysis and Trading Strategies Our Elliott Wave analysis covers t...

Read More >
Expert Elliott Wave Technical Analysis for ASX: REA GROUP LTD – Accurate Stock Forecasts and Winning Trading Strategies

Expert Elliott Wave Technical Analysis for ASX: REA GROUP LTD – Accurate Stock Forecasts and Winning Trading Strategies

Explore the comprehensive Elliott Wave analysis for ASX: REA GROUP LTD. This article provides an in-...

Read More >

$1 for 2 Weeks

then $29 a month!

What a Special Offer!

Trade Recommendations

Unleash the power of deversified trading with our comprehensive portfolio, covering 250+ markets:

  • Stock Trades
  • Crypto Trades
  • Forex Trades
  • Commodity Trades
Elliott Wave Analysis

Gain a competitive edge with expert insights and AI-powered Elliott Wave charting into:

  • Global Indices
  • US Stocks & ASX Stocks
  • Forex & Crypto
  • Commodities
Top-Notch Trading Tools

Equip yourself with the tools of success:

  • Real-time Chat rooms
  • Elliott Wave Algorithm
  • Portfolio tools
  • TradingLevels
  • Screener
  • Trading Game
7 Elliott Wave Analysts

Stay ahead of the market with daily charts and insightful videos
Your secret to strategic trading!

JOIN HERE


Welcome to TradingLounge (ASIC A.R.No. 321187), specialists in trades, trading education and technical analysis, covering stocks, indices, commodities, forex and cryptocurrencies.

When you join TradingLounge you have access to everything we offer, including trade tools, educational content and a social platform to chat with like-minded investors.

Read more

@Copyright 2024 by tradinglounge.com

Contact Us

Australian no: 02 4787 6020

International no: +61 (2) 47876020

Pay with:

Find us on