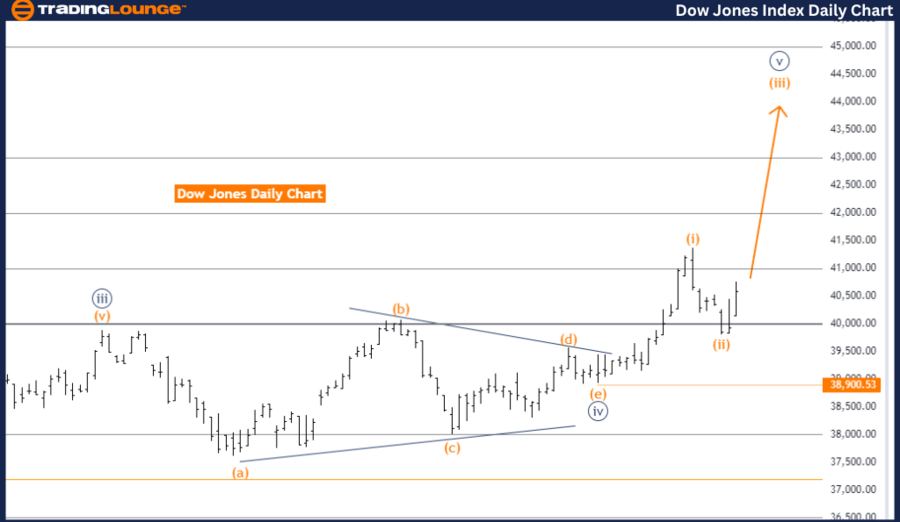
DOW JONES - DJI Elliott Wave Analysis Day Chart Overview
DOW JONES - DJI Elliott Wave Technical Analysis
Function: Trend
Mode: Impulsive
Structure: Orange wave 3
Position: Navy Blue Wave 5
Next Lower Degrees Direction: Orange wave 4
Details: The daily chart of the DOW JONES - DJI shows an impulsive trend based on Elliott Wave Analysis. The current wave structure is identified as orange wave 3, which is a component of the broader navy blue wave 5. This pattern indicates a bullish market trend, with orange wave 3 signifying an ongoing impulsive phase within navy blue wave 5.
The transition from orange wave 2 to orange wave 3 suggests the end of a corrective phase and the onset of a new upward impulsive wave. The market is currently in the early stages of orange wave 3, suggesting a continued upward movement.
Following the completion of orange wave 3, the analysis anticipates a corrective phase marked by orange wave 4. This phase will occur before any further upward movements in subsequent waves.
A critical level in this analysis is the wave cancellation invalid level, set at 38900.53. Should the market exceed this level, the current Elliott Wave structure would be invalidated, necessitating a reevaluation of the wave count and possibly altering the market outlook.
In conclusion, the DOW JONES - DJI daily chart reveals an impulsive trend with orange wave 3 currently developing within navy blue wave 5. The market has shifted from the corrective phase of orange wave 2 into the impulsive phase of orange wave 3. The analysis anticipates the next phase, orange wave 4, following the completion of the current wave. The wave cancellation invalid level at 38900.53 remains a pivotal point for validating this wave structure.
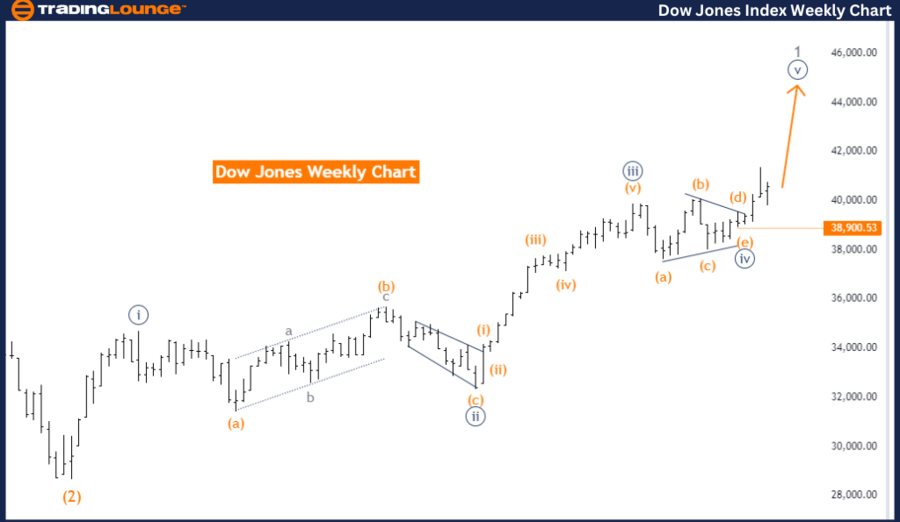
DOW JONES - DJI Elliott Wave Analysis Weekly Chart Overview
DOW JONES - DJI Elliott Wave Technical Analysis
Function: Trend
Mode: Impulsive
Structure: Navy blue wave 5
Position: Gray wave 1
Next Higher Degrees Direction: Continuation of navy blue wave 5
Details:
The weekly chart of the DOW JONES - DJI displays a trend function in an impulsive mode, characterized by the wave structure of navy blue wave 5 within gray wave 1. This configuration supports an upward market trend, propelled by the impulsive navy blue wave 5 within the larger gray wave 1 context.
The analysis indicates that navy blue wave 4 has been completed, signaling the end of a corrective phase and the start of a new impulsive phase, navy blue wave 5. This suggests the market is currently experiencing an upward momentum.
For the next higher degrees, the analysis suggests a continuation of the navy blue wave 5, predicting sustained upward movement as this wave progresses.
The wave cancellation invalid level, set at 38900.53, is a key consideration in this analysis. If the market surpasses this level, the current wave structure would be invalidated, prompting a reevaluation of the wave count and potentially altering the market perspective.
In summary, the DOW JONES - DJI weekly chart indicates the market is in an impulsive trend, with navy blue wave 5 active within gray wave 1. The transition from navy blue wave 4 to navy blue wave 5 marks the start of a new impulsive phase. The analysis foresees continued upward movement in navy blue wave 5. The wave cancellation invalid level of 38900.53 serves as a crucial point for confirming this wave structure.
Technical Analyst: Malik Awais
Source: visit Tradinglounge.com and learn From the Experts Join TradingLounge Here
See previous: Bovespa Index Elliott Wave Analysis
Special Trial Offer - 0.76 Cents a Day for 3 Months! Click here
Access 7 Analysts Over 170 Markets Covered. Chat Room With Support