31Mar

Corn Elliott Wave Analysis and Price Forecast: Bearish Trend, Technical Chart Patterns, and Long-Term Market Outlook Explained

Corn Elliott Wave Analysis

Corn futures remain under pressure, trading below the critical 504 resistance level after finalizing a significant bullish correction that began in August 2024. Current Elliott Wave patterns suggest a potential continuation lower toward the $400 price area. If bearish momentum continues, prices could break beneath the August 2024 low of $360 in a possible impulsive move.


Corn Long-Term and Daily Chart Analysis

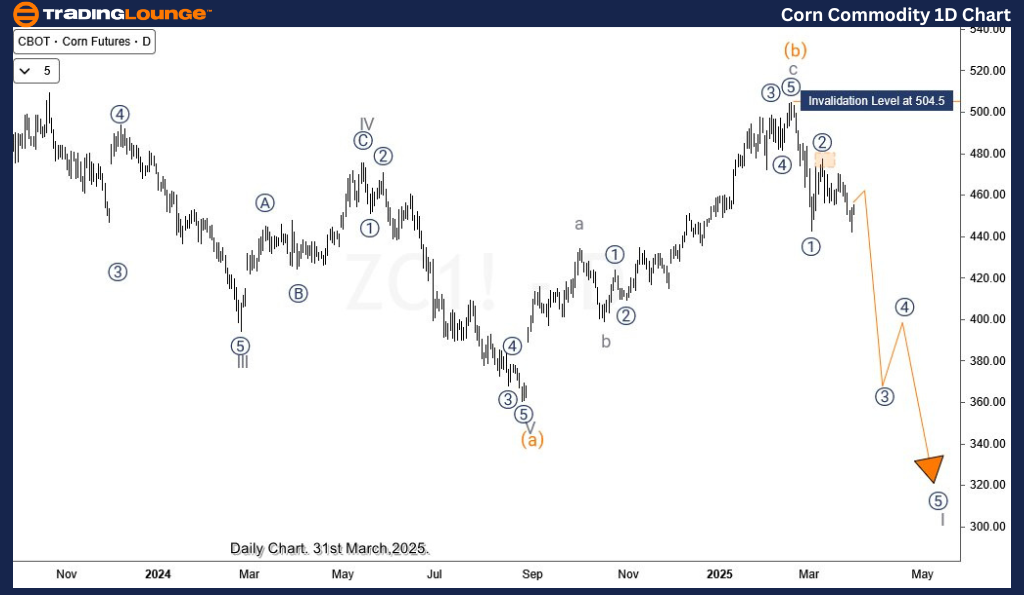
Since April 2022, corn prices have followed a long-term bearish trend, breaking key support levels after short-term rallies. A corrective rebound began from the August 2024 low. However, unless this rebound evolves into a complex double correction, the technical outlook supports another leg lower. This could result in a breakdown below the August 2024 low, extending the broader downtrend that started in April 2022.

According to Elliott Wave Theory, corn completed a 5-wave bearish sequence from April 2022, identified as wave (a) of the supercycle. The current recovery represents wave (b) of the same supercycle. After forming a 3-swing corrective structure, corn has turned lower again. The latest decline from February 2025 could conclude a minor 3-swing retracement before rallying higher to complete wave (b), or alternatively, initiate a stronger impulsive sell-off targeting sub-$360 levels for wave (c) of the supercycle.

Corn-commodity-1d-ch...


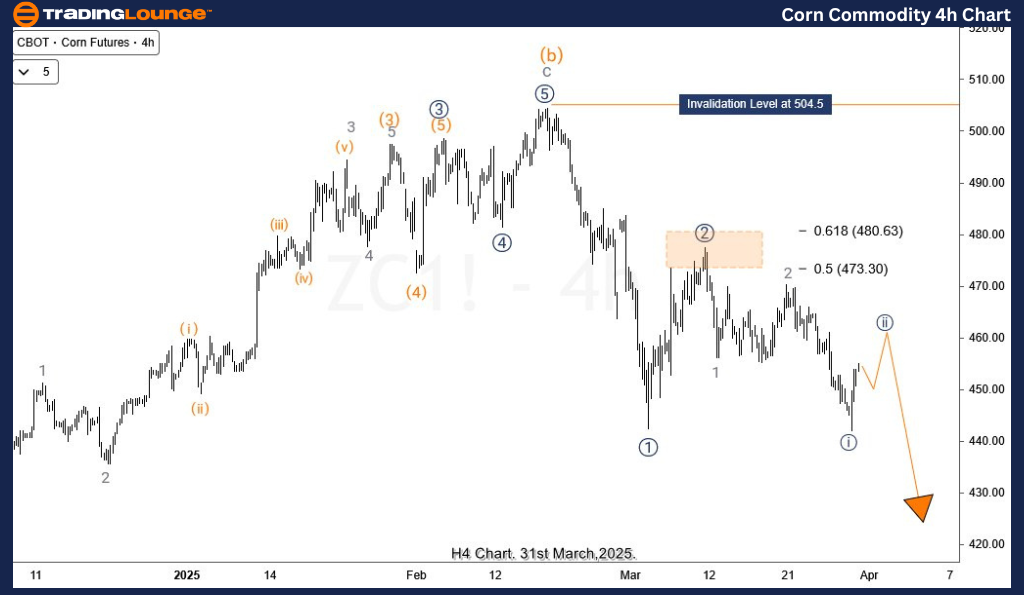
Corn H4 Chart Analysis

The 4-hour chart highlights completed waves ((1)) and ((2)) of the primary degree. The next wave, ((3)), is expected to push prices lower. Notably, a full impulsive wave structure has not yet materialized, leaving room for further downside. Until a defined 5-wave impulse appears, technical traders will monitor for at least a completed 3-swing decline, aiming toward the $420–$400 zone.

Technical Analyst: Sanmi Adeagbo

Source: Visit Tradinglounge.com and learn from the Experts Join TradingLounge Here 

See Previous: Coffee Elliott Wave Technical Analysis

VALUE Offer - Buy 1 Month & Get 3 Months!Click here

Access 7 Analysts Over 200 Markets Covered. Chat Room With Support

Corn-commodity-4h-ch...

Related

S&P 500 ELLIOTT WAVE ANALYSIS, 20 JAN 2022

S&P 500 ELLIOTT WAVE ANALYSIS, 20 JAN 2022

S&P500 Expect support at 4500, but eventually expect the market to move through this Minor Level and...

Read More >
Grayscale Ethereum Trust ETF – ETHE U.S ETF Elliott Wave Technical Analysis Shows Bearish Wave (v) Setup Ahead

Grayscale Ethereum Trust ETF – ETHE U.S ETF Elliott Wave Technical Analysis Shows Bearish Wave (v) Setup Ahead

ETHE enters wave (iv) correction with a potential $5 drop ahead. Elliott Wave count remains valid be...

Read More >
Impulse Wave iii) Topping—Elliott Wave Analysis of Major Indices and Tech Stocks

Impulse Wave iii) Topping—Elliott Wave Analysis of Major Indices and Tech Stocks

The strong upward movement in major stock indices and tech stocks suggests that impulse wave iii) ma...

Read More >
S&P/TSX 60 Elliott Wave Analysis: Orange Wave 4 Corrective Phase, Wave Predictions, Bullish Trends, and Market Insights

S&P/TSX 60 Elliott Wave Analysis: Orange Wave 4 Corrective Phase, Wave Predictions, Bullish Trends, and Market Insights

Gain valuable insights into the S&P/TSX 60 Index with a thorough Elliott Wave analysis. Explore the ...

Read More >
Wheat's Commodity market trends and prepare for significant recovery opportunities: Wheat Elliott Wave Technical Analysis

Wheat's Commodity market trends and prepare for significant recovery opportunities: Wheat Elliott Wave Technical Analysis

Our comprehensive Wheat Elliott Wave analysis covers trend forecasts, price predictions, and key sup...

Read More >
Mastercard Inc. (MA) Elliott Wave Analysis Shows Bullish Wave 3 Targeting $595 and $650 Key Resistance Levels for Traders

Mastercard Inc. (MA) Elliott Wave Analysis Shows Bullish Wave 3 Targeting $595 and $650 Key Resistance Levels for Traders

Mastercard (MA) Elliott Wave analysis forecasts an ongoing bullish move in Wave 3, targeting $595 an...

Read More >

$1 for 2 Weeks

then $29 a month!

What a Special Offer!

Trade Recommendations

Unleash the power of deversified trading with our comprehensive portfolio, covering 250+ markets:

  • Stock Trades
  • Crypto Trades
  • Forex Trades
  • Commodity Trades
Elliott Wave Analysis

Gain a competitive edge with expert insights and AI-powered Elliott Wave charting into:

  • Global Indices
  • US Stocks & ASX Stocks
  • Forex & Crypto
  • Commodities
Top-Notch Trading Tools

Equip yourself with the tools of success:

  • Real-time Chat rooms
  • Elliott Wave Algorithm
  • Portfolio tools
  • TradingLevels
  • Screener
  • Trading Game
7 Elliott Wave Analysts

Stay ahead of the market with daily charts and insightful videos
Your secret to strategic trading!

JOIN HERE


Welcome to TradingLounge (ASIC A.R.No. 321187), specialists in trades, trading education and technical analysis, covering stocks, indices, commodities, forex and cryptocurrencies.

When you join TradingLounge you have access to everything we offer, including trade tools, educational content and a social platform to chat with like-minded investors.

Read more

@Copyright 2024 by tradinglounge.com

Contact Us

Australian no: 02 4787 6020

International no: +61 (2) 47876020

Pay with:

Find us on