ASX: NATIONAL AUSTRALIA BANK LIMITED - NAB Stock Analysis | TradingLounge (1D Chart)

Greetings, our updated Elliott Wave analysis on the Australian Stock Exchange (ASX) focuses on NATIONAL AUSTRALIA BANK LIMITED - NAB. The NAB.ASX chart indicates a potential upward movement in wave (iii)-orange.

ASX: NATIONAL AUSTRALIA BANK LIMITED - NAB Elliott Wave Technical Analysis

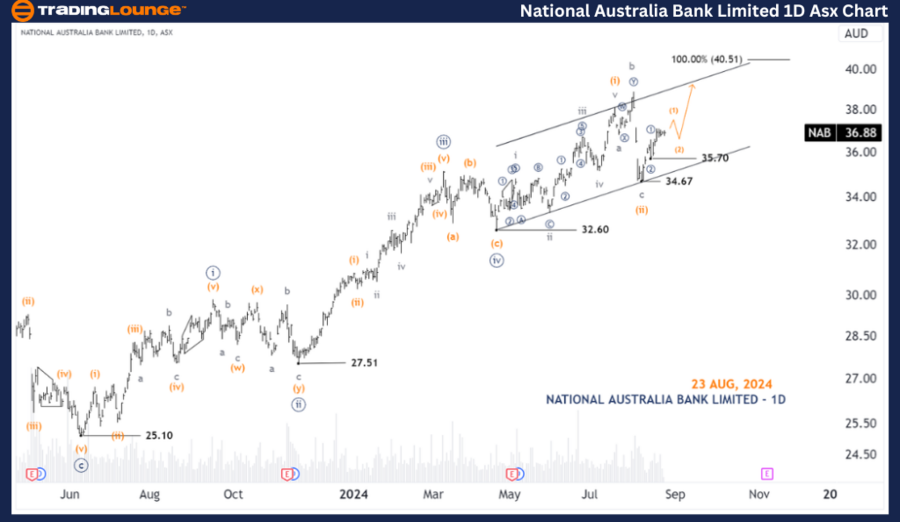
ASX: NATIONAL AUSTRALIA BANK LIMITED - NAB 1D Chart (Semilog Scale) Analysis

Function: Major Trend (Minute Degree, Navy)

Mode: Motive

Structure: Impulse

Position: Wave (iii)-orange of Wave ((v))-navy

Details: From the recent low at 34.67, wave (iii)-orange is developing and subdividing into smaller waves ((1)), ((2))-navy, and currently, wave (1)-orange. We anticipate wave (2)-orange to dip slightly before wave (3)-orange resumes its upward movement.

Invalidation Point: 35.70

National-Australia-B...


ASX: NATIONAL AUSTRALIA BANK LIMITED | TradingLounge (4-Hour Chart)

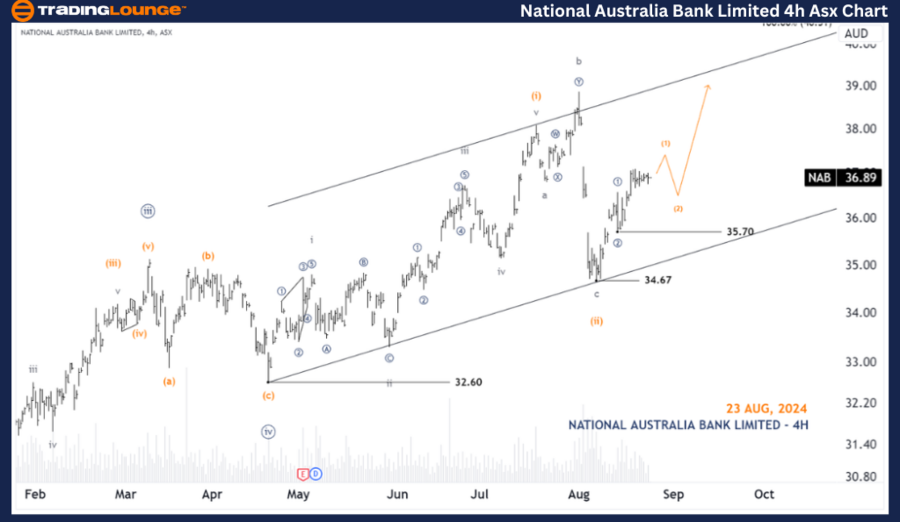
ASX: NATIONAL AUSTRALIA BANK LIMITED - NAB 4-Hour Chart Analysis

Function: Major Trend (Minuette Degree, Orange)

Mode: Motive

Structure: Impulse

Position: Wave (2)-orange of Wave ((3))-navy of Wave (iii)-orange

Details: Wave ((3))-navy is progressing upward, subdividing into wave (1)-orange. With price pushing higher, wave (1)-orange may conclude soon, followed by a minor retracement in wave (2)-orange. Eventually, wave (3)-orange is expected to continue the upward trend, targeting the upper edge of the Channel.

Invalidation Point: 35.70

Technical Analyst: Hua (Shane) Cuong, CEWA-M (Master’s Designation).

Source: visit Tradinglounge.com and learn From the Experts Join TradingLounge Here 

Previous:  ASX LIMITED – ASX Elliott Wave Technical Analysis

Special Trial Offer - 0.76 Cents a Day for 3 Months! Click here

Access 7 Analysts Over 200 Markets Covered. Chat Room With Support

National-Australia-B...


Conclusion:

Our analysis and forecast of the short-term trends for ASX: NATIONAL AUSTRALIA BANK LIMITED - NAB aim to offer valuable insights into the market's current direction and how to navigate it effectively. We provide key price points that serve as validation or invalidation for our wave count, helping to bolster confidence in our analysis. By integrating these elements, we aim to deliver the most objective and professional perspective on market trends.

Related

Berkshire Hathaway Inc. (BRK.B) Elliott Wave Analysis: Stock Forecast, Trend Outlook, and Technical Analysis for Bullish Momentum

Berkshire Hathaway Inc. (BRK.B) Elliott Wave Analysis: Stock Forecast, Trend Outlook, and Technical Analysis for Bullish Momentum

Berkshire Hathaway (BRK.B) remains in an impulsive Elliott Wave structure, progressing through Wave ...

Read More >
Bullish Momentum Continues: BTCUSD Elliott Wave Technical Analysis with potential trading opportunities

Bullish Momentum Continues: BTCUSD Elliott Wave Technical Analysis with potential trading opportunities

The BTCUSD Elliott Wave analysis for February 19, 24 indicates a bullish trend with potential tradin...

Read More >
Riding the Trend Wave: Crypto Price News Today Chainlink/ U.S. dollar (LINKUSD) Elliott Wave Technical Analysis

Riding the Trend Wave: Crypto Price News Today Chainlink/ U.S. dollar (LINKUSD) Elliott Wave Technical Analysis

Discover the latest insights into Chainlink/ U.S. dollar (LINKUSD) cryptocurrency trading with our c...

Read More >
Wheat Commodity Elliott Wave Technical Analysis: Bullish Corrections and Future Price Movements in Wheat Futures

Wheat Commodity Elliott Wave Technical Analysis: Bullish Corrections and Future Price Movements in Wheat Futures

Our latest wheat price forecast for 2024 is based on Elliott Wave analysis, highlighting key market ...

Read More >
Trading Strategies: Apple (AAPL), Tesla (TSLA),Nvidia (NVDA),SP500 (SPX) Plus Bitcoin

Trading Strategies: Apple (AAPL), Tesla (TSLA),Nvidia (NVDA),SP500 (SPX) Plus Bitcoin

Trading Strategies: SP500 (SPX), NASDAQ 100 (NDX), Apple (AAPL), Tesla (TSLA), Amazon (AMZN), Nvidia...

Read More >
SEIUSD Elliott Wave Overview: Daily & H4 Chart Guide – Wave 2 Correction, $0.220 Breakout, Fibonacci Setup, Swing‑Trade Strategy

SEIUSD Elliott Wave Overview: Daily & H4 Chart Guide – Wave 2 Correction, $0.220 Breakout, Fibonacci Setup, Swing‑Trade Strategy

This article provides an in‑depth Elliott Wave analysis for SEI/USD on both Daily and H4 charts. It...

Read More >

$1 for 2 Weeks

then $29 a month!

What a Special Offer!

Trade Recommendations

Unleash the power of deversified trading with our comprehensive portfolio, covering 250+ markets:

  • Stock Trades
  • Crypto Trades
  • Forex Trades
  • Commodity Trades
Elliott Wave Analysis

Gain a competitive edge with expert insights and AI-powered Elliott Wave charting into:

  • Global Indices
  • US Stocks & ASX Stocks
  • Forex & Crypto
  • Commodities
Top-Notch Trading Tools

Equip yourself with the tools of success:

  • Real-time Chat rooms
  • Elliott Wave Algorithm
  • Portfolio tools
  • TradingLevels
  • Screener
  • Trading Game
7 Elliott Wave Analysts

Stay ahead of the market with daily charts and insightful videos
Your secret to strategic trading!

JOIN HERE


Welcome to TradingLounge (ASIC A.R.No. 321187), specialists in trades, trading education and technical analysis, covering stocks, indices, commodities, forex and cryptocurrencies.

When you join TradingLounge you have access to everything we offer, including trade tools, educational content and a social platform to chat with like-minded investors.

Read more

@Copyright 2024 by tradinglounge.com

Contact Us

Australian no: 02 4787 6020

International no: +61 (2) 47876020

Pay with:

Find us on