Bovespa Index Elliott Wave Technical Analysis
Function: Bullish Trend
Mode: Impulsive
Structure: Orange Wave 1
Position: Navy Blue Wave 3
Next Lower Degree Direction: Orange Wave 2
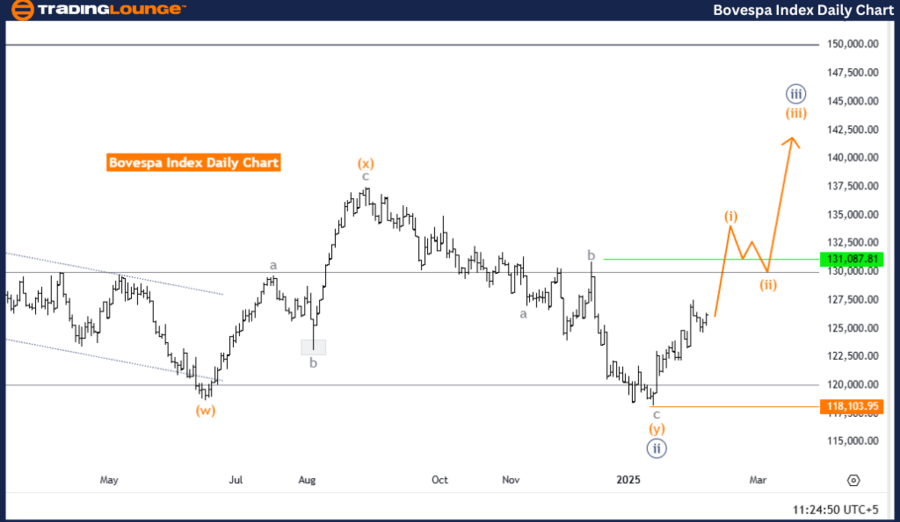
Details: Navy Blue Wave 2 appears complete; Orange Wave 1 of 3 is now developing.
Wave Cancel Invalidation Level: 118,103.95
The Bovespa Index daily chart reflects a bullish Elliott Wave structure, currently in an impulsive mode. The primary focus is on Orange Wave 1 within Navy Blue Wave 3, which is developing after the completion of Navy Blue Wave 2.
The successful transition from Navy Blue Wave 2 to Orange Wave 1 suggests the market has shifted from a corrective phase to a bullish trend, driven by increased buying interest. Typically, Orange Wave 1 marks the initial stage of a new upward cycle, characterized by higher price action and strengthening momentum.
As Navy Blue Wave 3 unfolds, the market is expected to sustain its bullish momentum, with Orange Wave 1 acting as the foundation for further price advances. The Wave Cancel Invalidation Level is 118,103.95—a breach of this level would necessitate a reassessment of the Elliott Wave structure and the broader market outlook.
The formation of Orange Wave 1 signals the potential for higher impulsive waves in the near term. Traders should remain vigilant, monitoring price movements and market conditions to capitalize on bullish opportunities while being cautious of any deviations from the projected wave pattern.
Conclusion
The Bovespa Index daily chart presents a strong bullish trend as Orange Wave 1 within Navy Blue Wave 3 develops. The completion of Navy Blue Wave 2 suggests renewed buying strength, supporting further price appreciation. Traders should observe price action near the invalidation level (118,103.95) for confirmation of the bullish setup and adjust strategies accordingly.
Bovespa Index Elliott Wave Analysis – Trading Lounge Weekly Chart
Bovespa Index Elliott Wave Technical Analysis
Function: Bullish Trend
Mode: Impulsive
Structure: Navy Blue Wave 3
Position: Gray Wave 3
Next Higher Degree Direction: Navy Blue Wave 3 (Started)
Details: Navy Blue Wave 2 appears complete; Navy Blue Wave 3 is now in progress.
Wave Cancel Invalidation Level: 118,103.95
The Bovespa Index weekly chart confirms a bullish Elliott Wave pattern, with the market currently progressing in an impulsive phase. The focus is on Navy Blue Wave 3, which has begun after the completion of Navy Blue Wave 2. This suggests the market has transitioned from a corrective phase into a stronger bullish cycle.
The completion of Navy Blue Wave 2 indicates renewed buying pressure, setting the stage for the development of Navy Blue Wave 3. This impulsive wave is typically associated with strong bullish momentum, characterized by higher price levels, increased volume, and sustained uptrends.
The positioning within Gray Wave 3 further reinforces the bullish outlook, as this wave typically represents the middle phase of an extended upward cycle. Given this structure, the market is expected to continue its uptrend, with further price gains likely as Navy Blue Wave 3 progresses.
The Wave Cancel Invalidation Level is set at 118,103.95. A price drop below this level would invalidate the current wave setup, requiring a reassessment of market conditions. Traders should actively monitor price action and momentum to confirm the continuation of the bullish scenario.
Conclusion
The Bovespa Index weekly chart maintains a strong bullish outlook, with Navy Blue Wave 3 progressing within Gray Wave 3. The completion of Navy Blue Wave 2 suggests strong buying interest, supporting further upside potential. Traders should pay close attention to price behavior near the invalidation level (118,103.95) for an accurate market assessment and to make informed trading decisions.
Technical Analyst: Malik Awais
Source: visit Tradinglounge.com and learn From the Experts Join TradingLounge Here
Previous: IBEX 35 (Spain) Elliott Wave Technical Analysis