USDCAD Elliott Wave Analysis – TradingLounge Daily Chart
U.S. Dollar / Canadian Dollar (USDCAD) – Daily Chart Analysis
USDCAD Elliott Wave Technical Analysis
FUNCTION: Bearish Trend
MODE: Impulsive
STRUCTURE: Orange Wave 3
POSITION: Navy Blue Wave 3
DIRECTION NEXT HIGHER DEGREES: Orange Wave 4
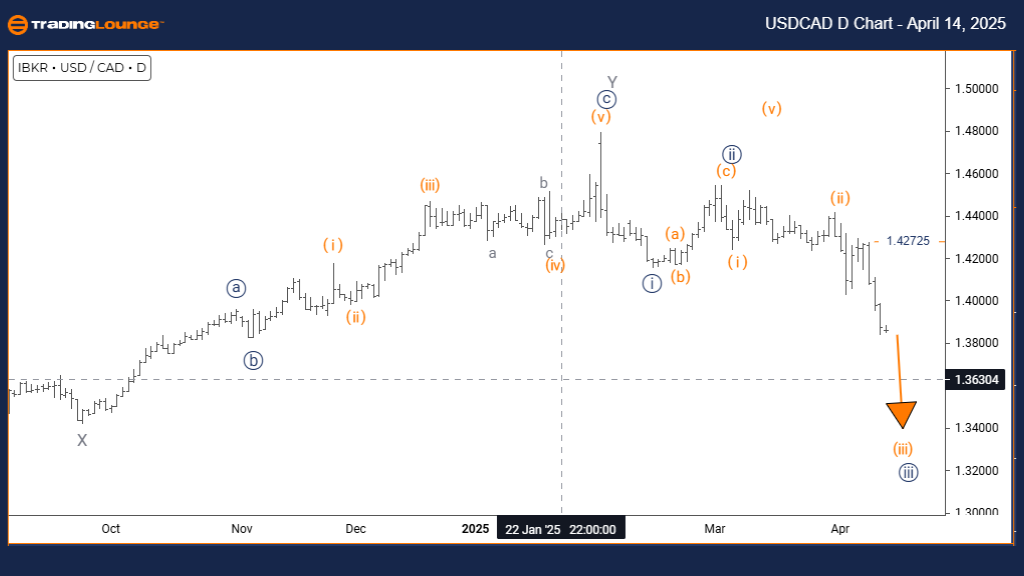
DETAILS: Orange wave 2 appears completed; currently in orange wave 3
Wave Cancel Invalid Level: 1.42725
USDCAD Elliott Wave Forecast: Bearish Impulse Builds Momentum
The USDCAD daily chart reveals a developing bearish impulse wave structure, aligning with a strong downtrend in the Elliott Wave pattern. Following the likely completion of orange wave 2, the market has entered orange wave 3, which is nested within the larger navy blue wave 3. This suggests increasing downside momentum, consistent with broader bearish sentiment.
Historically, orange wave 3 tends to be the most powerful wave in an impulsive sequence, often breaking past the low of wave 1 with extended price action. With wave 2 concluded, wave 3 is expected to deepen, likely accelerating bearish movement. Traders should anticipate this momentum to continue, supported by rising volume and increased volatility.
As wave 3 progresses, the next key development will be orange wave 4—expected to offer a corrective pullback or consolidation phase before bearish continuation resumes. Monitor Fibonacci extension zones closely for signs of wave 3 completion and wave 4 emergence.
The critical resistance level at 1.42725 marks the high of wave 2 and acts as the invalidation point for this bearish count. Any price movement above this level will nullify the current wave scenario, prompting a reevaluation of the structure.
Traders should remain focused on this impulsive wave structure and continue managing positions in line with the bearish trend. Volume spikes and momentum indicators will be vital in identifying the wave shift from 3 to 4.
U.S. Dollar / Canadian Dollar (USDCAD) – TradingLounge 4-Hour Chart
USDCAD Elliott Wave Technical Analysis
FUNCTION: Bearish Trend
MODE: Impulsive
STRUCTURE: Gray Wave 3
POSITION: Orange Wave 3
DIRECTION NEXT HIGHER DEGREES: Gray Wave 4
DETAILS: Gray wave 2 appears completed; currently in gray wave 3
Wave Cancel Invalid Level: 1.42725
USDCAD 4-Hour Elliott Wave Update: Downtrend Extends in Wave 3
On the 4-hour chart, USDCAD confirms an impulsive bearish Elliott Wave structure, with the market currently advancing through gray wave 3. This movement develops within a broader orange wave 3, reinforcing a multi-timeframe downtrend.
Gray wave 3 is typically the most dynamic segment of an Elliott sequence, known for strong directional bias and increased volume. Following the end of gray wave 2, the current progression suggests deeper downside potential, as wave 3 accelerates toward its Fibonacci targets.
Looking ahead, gray wave 4 is expected once the current impulse completes. This upcoming phase may introduce temporary support or consolidation, presenting tactical trade opportunities. Watch for signals such as divergence or volume shifts to anticipate this wave transition.
The invalidation level remains at 1.42725—breaching this point invalidates the current bearish wave count and calls for a structural reassessment. This level serves as a technical benchmark for managing trade exposure and risk.
Overall, the continuation of the impulsive gray wave 3 underlines strong bearish market behavior. Maintain a short bias as long as price action respects the structure. Confirm developments with momentum tools and trend indicators for precise entry and exit strategies
Technical Analyst: Malik Awais
Source: Visit Tradinglounge.com and learn from the Experts. Join TradingLounge Here
Previous: EURUSD Elliott Wave Technical Analysis
VALUE Offer - Buy 1 Month & Get 3 Months!Click here
Access 7 Analysts Over 200 Markets Covered. Chat Room With Support
