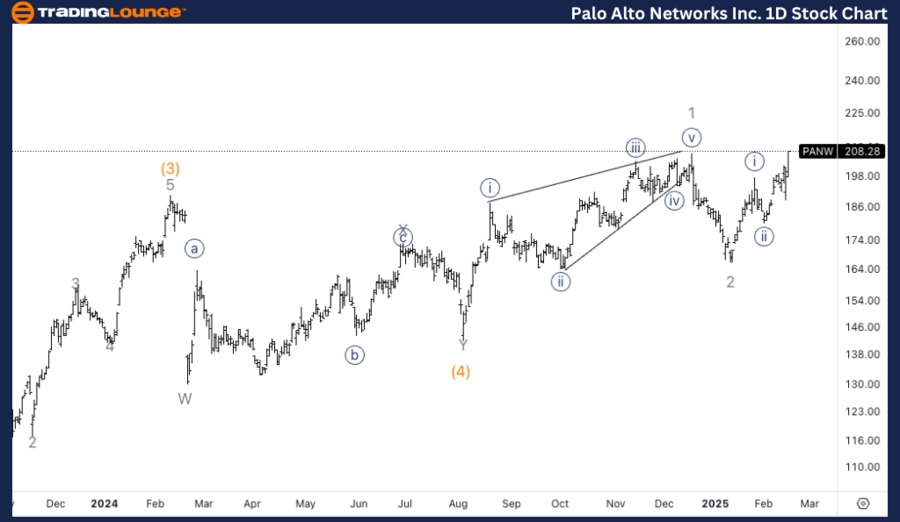
Palo Alto Networks Inc. (PANW) – Elliott Wave Daily Chart Analysis
PANW Elliott Wave Technical Analysis
Function: Trend
Mode: Motive
Structure: Impulsive
Position: Wave 3 of (5)
Direction: Upside into wave 3
Details:
Palo Alto Networks Inc. (PANW) is demonstrating strong bullish momentum within wave 3, following a leading diagonal in Minor wave 1. The stock’s next key resistance level is set at $300, signaling further upside potential. This aligns with Elliott Wave principles, indicating an extended rally in wave 3.
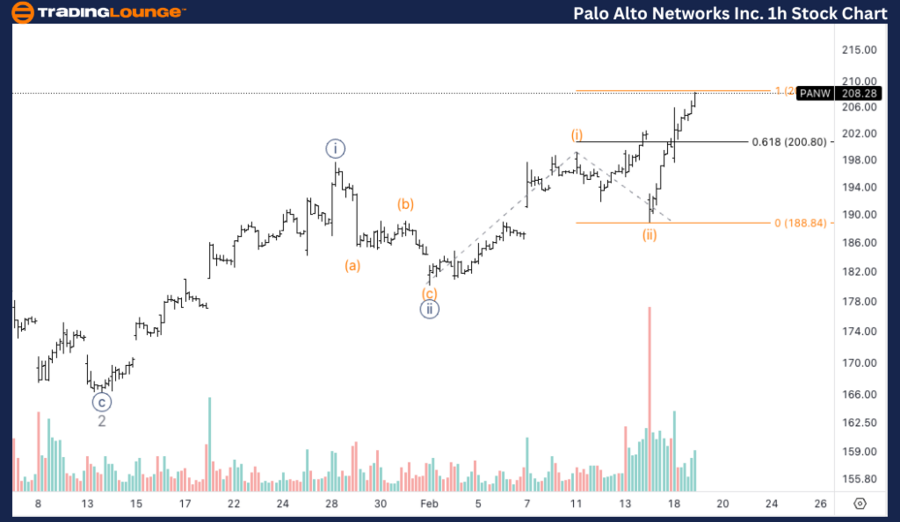
Palo Alto Networks Inc. (PANW) – Elliott Wave 1-Hour Chart Analysis
Function: Trend
Mode: Motive
Structure: Impulsive
Position: Wave (iii) of {iii}
Direction: Upside into wave (iii) of {iii}
Details:
A high-volume breakout above $200 has confirmed the continuation of the bullish trend. The 1.618 Fibonacci extension of wave (iii) versus wave (i) projects a short-term target of $220, supporting additional upward momentum. The structure suggests a strong rally in the near term, aligning with the Elliott Wave framework for impulsive moves.
Technical Analyst: Alessio Barretta
Source: visit Tradinglounge.com and learn From the Experts Join TradingLounge Here
See Previous: Netflix Inc. (NFLX) Elliott Wave Technical Analysis
VALUE Offer - Buy 1 Month & Get 3 Months!Click here
Access 7 Analysts Over 200 Markets Covered. Chat Room With Support