05Mar

WTI Crudeoil Elliott Wave Analysis: Technical Chart Outlook, Market Trends, Support & Resistance Levels, and Trading Strategy

WTI Crudeoil Elliott Wave Forecast

WTI crude oil continues to extend its decline from January 2025, reaching the lower boundary of the sideways price formation that has been developing since March 2023. However, the structure appears incomplete, suggesting that this lower boundary could act as a strong support zone. If so, this may trigger a corrective bounce, retracing part of the losses incurred since the January 2025 downturn.

WTI Daily Chart Analysis

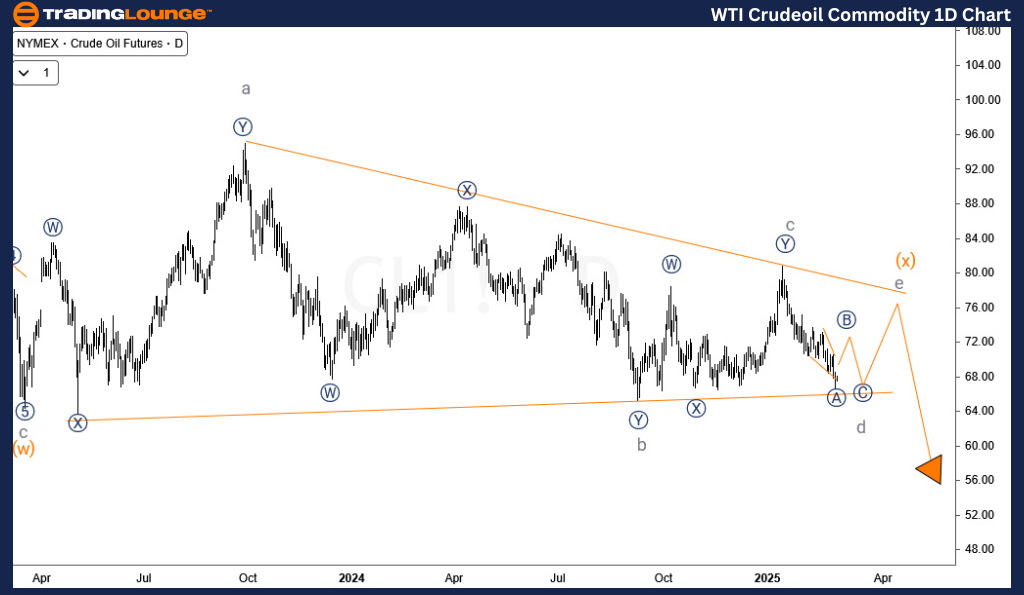
From a long-term perspective, the decline in WTI from March 2022 is serving as a correction to the strong impulse rally that began at the lows of the Covid crash in April 2020. This corrective phase has taken the form of a double zigzag pattern. In this structure, wave (w) of the supercycle degree concluded in March 2023, followed by wave (x), which has evolved into a sideways triangle formation.

The triangle consists of five corrective sub-waves, where the January 2023 pullback represents cycle degree wave d within supercycle degree wave (x). Given this setup, a final upward movement is expected before a significant sell-off resumes, aligning with broader Elliott Wave projections.

WTI-Crudeoil-1d-comm...


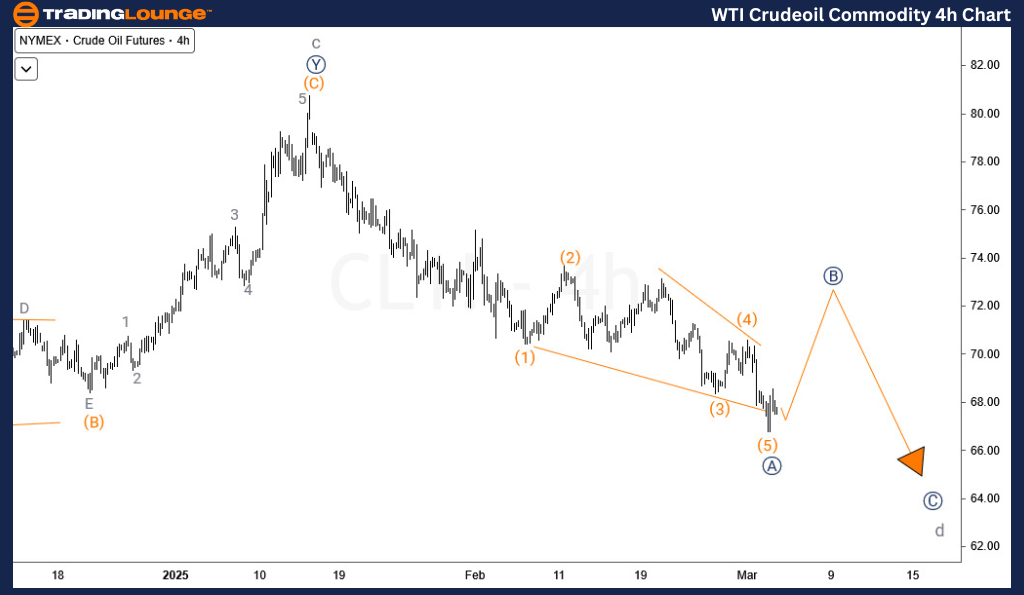
WTI H4 Chart Analysis

The H4 timeframe illustrates that WTI has completed a diagonal structure for wave ((A)) of d, indicating a potential bounce for wave ((B)) before another downward leg develops. However, an alternative scenario suggests that wave d may have already been finalized, which could lead to a stronger bullish reversal than initially anticipated. Traders should monitor price action closely to confirm whether the corrective rally gains momentum or if further declines remain on the horizon.

Technical Analyst: Sanmi Adeagbo

Source: visit Tradinglounge.com and learn From the Experts Join TradingLounge Here 

See Previous: Soybean Elliott Wave Technical Analysis

VALUE Offer - Buy 1 Month & Get 3 Months!Click here

Access 7 Analysts Over 200 Markets Covered. Chat Room With Support

WTI-Crudeoil-4h-comm...

Related

TASI Index Elliott Wave Technical Analysis: Detailing its Current and Projected Market Movements.

TASI Index Elliott Wave Technical Analysis: Detailing its Current and Projected Market Movements.

This article provides an in-depth Elliott Wave analysis of the TASI Index, detailing its current and...

Read More >
Unlocking Elliott Wave Technical Analysis of Gold Commodity: A Comprehensive Guide to Price Trends and Investment Strategies

Unlocking Elliott Wave Technical Analysis of Gold Commodity: A Comprehensive Guide to Price Trends and Investment Strategies

This article offers an in-depth look at the gold commodity market, providing readers with a detailed...

Read More >
NEWMONT CORPORATION (ASX:NEM) Elliott Wave Technical Analysis – Stock Price Prediction, Support & Resistance Levels for Investors

NEWMONT CORPORATION (ASX:NEM) Elliott Wave Technical Analysis – Stock Price Prediction, Support & Resistance Levels for Investors

Elliott Wave technical analysis of NEWMONT CORPORATION (ASX: NEM), highlighting potential price move...

Read More >
Hang Seng Index Elliott Wave Analysis: HSI Market Outlook, Bullish Trend, Trading Strategy, Price Prediction & Technical Insights

Hang Seng Index Elliott Wave Analysis: HSI Market Outlook, Bullish Trend, Trading Strategy, Price Prediction & Technical Insights

Hang Seng Index Elliott Wave analysis provides an in-depth HSI market outlook, focusing on wave stru...

Read More >
NEO Crypto Price: Key Technical Indicators to enhance your trading decisions: NEOUSD Elliott Wave Technical Analysis

NEO Crypto Price: Key Technical Indicators to enhance your trading decisions: NEOUSD Elliott Wave Technical Analysis

Explore comprehensive Elliott Wave analysis for NEO/USD, including daily and H4 chart insights, corr...

Read More >
Comprehensive Elliott Wave Analysis of TJX Companies Inc. with Daily and 1-Hour Chart Insights and Stock Projections

Comprehensive Elliott Wave Analysis of TJX Companies Inc. with Daily and 1-Hour Chart Insights and Stock Projections

This Elliott Wave analysis of TJX Companies Inc. (TJX) provides a detailed look at daily and 1-hour ...

Read More >

Buy 1 Month

Get 3 Months!

Special Offer:

Trade Recommendations

Unleash the power of deversified trading with our comprehensive portfolio, covering:

  • Stock Trades
  • Crypto Trades
  • Forex Trades
  • Commodity Trades
Elliott Wave Analysis

Gain a competive edge with expert insights in to:

  • Global Indices
  • US Stocks & ASX Stocks
  • Forex & Crypto
  • Commodities
Top-Notch Trading Tools

Equip yourself with the tools of success:

  • Social Chat
  • Elliott Wave Algorithm
  • Screener
  • TradingLevels
  • Trading Game
7 Elliott Wave Analysts

Stay ahead of the market with daily charts and insightful videos
-Your secret to strategic trading!

JOIN HERE


Welcome to TradingLounge (ASIC A.R.No. 321187), specialists in trades, trading education and technical analysis, covering stocks, indices, commodities, forex and cryptocurrencies.

When you join TradingLounge you have access to everything we offer, including trade tools, educational content and a social platform to chat with like-minded investors.

Read more

@Copyright 2024 by tradinglounge.com

Contact Us

Australian no: 02 4787 6020

International no: +61 (2) 47876020

Pay with:

Find us on