08Apr

Natural Gas Commodity Elliottwave Technical Analysis: Focusing on the Current Bearish Trend

Natural Gas Elliottwave Analysis

Natural Gas Day Chart Analysis

Natural Gas Elliottwave Technical Analysis
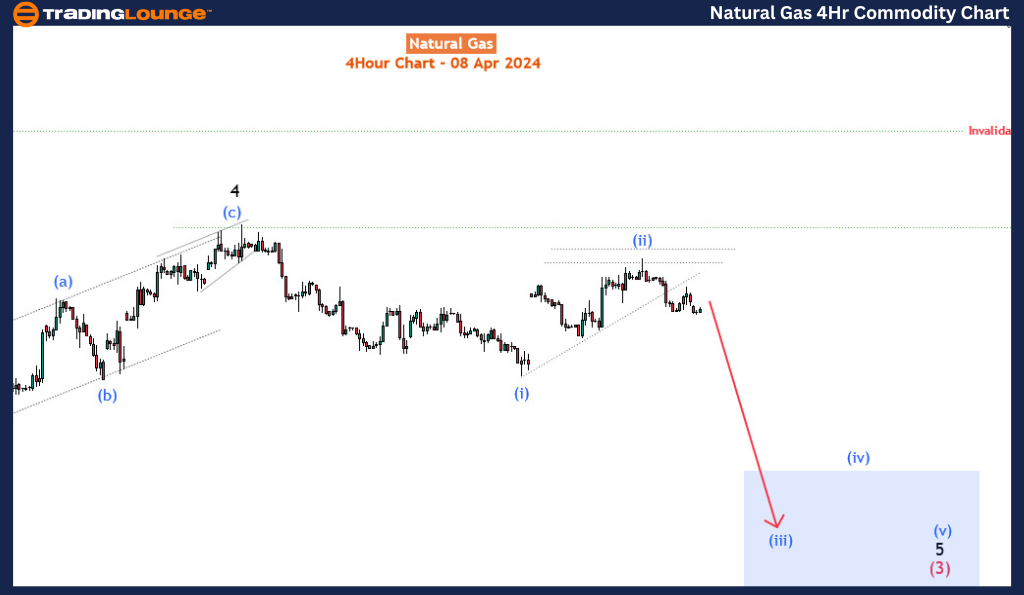
Mode - Impulsive

Structure - Impulse Wave

Position - Wave (ii) of 5

Direction - Wave (iii) of 5

Details:  Wave (ii) is completed and the price is now in wave (iii) and expected to extend to 1.35 or below. Wave 4 invalidation is around 2.00.

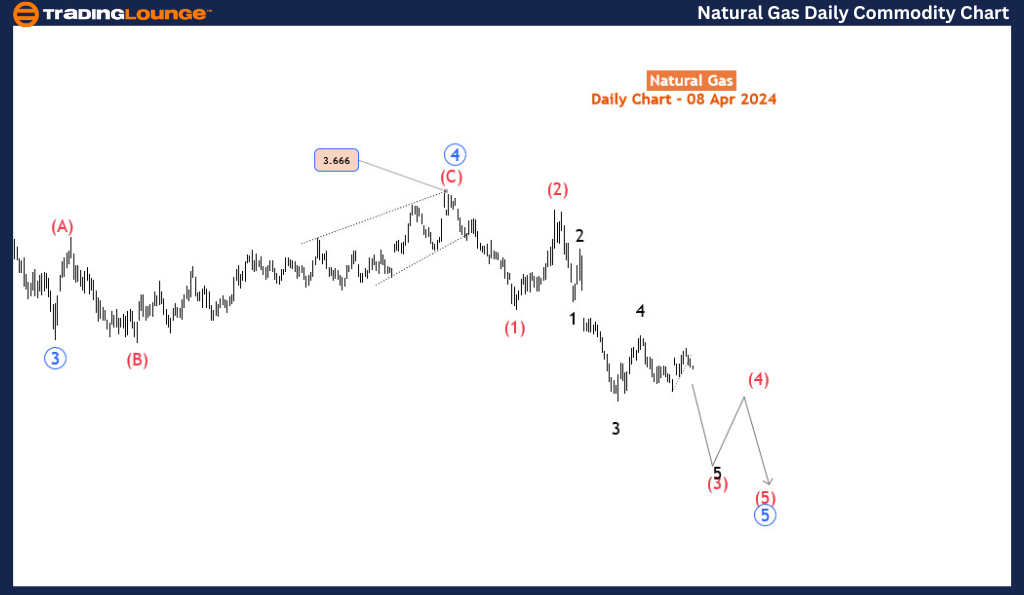
The journey of Natural Gas embarked on a bearish impulse wave pattern on August 22, 2022. Since then, the trend has persistently carved lower lows without revisiting previous highs, emblematic of the steadfast bearish sentiment prevailing in the market. Despite a minor bounce, the commodity has struggled to breach the low set on February 20, 2024. It's unlikely that this modest recovery will dissuade sellers from reentering the market. Ultimately, the price is anticipated to breach that low, signaling a continuation of the bearish trend. In today's blog post, we aim to scrutinize the extent of the bearish trend and forecast when a substantial recovery might materialize.

On the daily chart, the bearish trend since August 22, 2022, is identified as the 5th wave - circled as blue wave 5. This 5th wave is further subdivided into 5 waves, characteristic of an impulse wave. Presently, the price is within wave 5 of (3) of blue wave 5. However, wave 5 has yet to conclude - a prerequisite being a breach of the low recorded on February 20, 2024 (wave 3 low). This wave count remains valid as long as the price remains below the low of wave (1) (2.236).

Natural-Gas-Commodit...


TradingLounge Natural Gas Elliott Wave Analysis

Natural Gas 4-Hour Chart Analysis

Transitioning to the H4 timeframe, Wave 4 of (3) terminated around the 2.00 major level on March 5, 2024. Subsequently, wave 5 of (3) commenced, expected to finalize either as an impulse or an ending diagonal. The retracement observed from March 25 occurred at a critical supply zone, eliciting a downward reaction in price. Consequently, wave (iii) is currently unfolding, poised for confirmation upon a break below the low of wave (i) at 1.589. There's still ample room for bears to exert downward pressure on this commodity. The medium-term target for the culmination of blue wave 5 is projected to be 1.00, assuming price action unfolds as anticipated. In summary, the bearish trend remains steadfast and could persist below 2.00 in the near term. Traders should remain vigilant and adjust their strategies in line with the evolving market dynamics.

Technical Analyst: Sanmi Adeagbo

Source: visit Tradinglounge.com and learn From the Experts Join TradingLounge Here 

See Previous: Coffee

TradingLounge Once Off SPECIAL DEAL: Here > 1 month Get 3 months

TradingLounge's Free Week Extravaganza!

April 14 – 21: Unlock the Doors to Trading Excellence — Absolutely FREE

Natural-Gas-Commodit...

Related

EURUSD Elliott Wave Analysis: Expert Forex Forecast, Trading Strategies, and Market Trends for Informed Decisions

EURUSD Elliott Wave Analysis: Expert Forex Forecast, Trading Strategies, and Market Trends for Informed Decisions

EURUSD Elliott Wave analysis to stay ahead in the forex market. Learn about key chart patterns, mar...

Read More >
Elliott Wave Technical Analysis for Walmart Inc. (WMT), Including Detailed Forecasts and Current Price Movements

Elliott Wave Technical Analysis for Walmart Inc. (WMT), Including Detailed Forecasts and Current Price Movements

Explore the most recent Elliott Wave analysis for Walmart Inc. (WMT), including detailed forecasts a...

Read More >
Gold (XAUUSD) Commodity Elliott Wave Technical Analysis: Examining the latest trends and price movements

Gold (XAUUSD) Commodity Elliott Wave Technical Analysis: Examining the latest trends and price movements

This article provides an in-depth Elliott Wave analysis of the gold market, examining the latest tre...

Read More >
In-Depth Analysis breaks down the Uniswap Crypto UNIUSD Elliott Wave Technical Analysis and Price Movements

In-Depth Analysis breaks down the Uniswap Crypto UNIUSD Elliott Wave Technical Analysis and Price Movements

This article provides an in-depth Elliott Wave Uniswap (UNIUSD) analysis, focusing on the latest pri...

Read More >
Forex Analysis of Euro/U.S. Dollar EURUSD Using Elliott Wave Theory Provides Insights into the Current Market Trends

Forex Analysis of Euro/U.S. Dollar EURUSD Using Elliott Wave Theory Provides Insights into the Current Market Trends

This detailed analysis of EURUSD using Elliott Wave Theory provides insights into the current market...

Read More >

$1 for 2 Weeks

then $29 a month!

What a Special Offer!

Trade Recommendations

Unleash the power of deversified trading with our comprehensive portfolio, covering 250+ markets:

  • Stock Trades
  • Crypto Trades
  • Forex Trades
  • Commodity Trades
Elliott Wave Analysis

Gain a competitive edge with expert insights and AI-powered Elliott Wave charting into:

  • Global Indices
  • US Stocks & ASX Stocks
  • Forex & Crypto
  • Commodities
Top-Notch Trading Tools

Equip yourself with the tools of success:

  • Real-time Chat rooms
  • Elliott Wave Algorithm
  • Portfolio tools
  • TradingLevels
  • Screener
  • Trading Game
7 Elliott Wave Analysts

Stay ahead of the market with daily charts and insightful videos
Your secret to strategic trading!

JOIN HERE


Welcome to TradingLounge (ASIC A.R.No. 321187), specialists in trades, trading education and technical analysis, covering stocks, indices, commodities, forex and cryptocurrencies.

When you join TradingLounge you have access to everything we offer, including trade tools, educational content and a social platform to chat with like-minded investors.

Read more

@Copyright 2024 by tradinglounge.com

Contact Us

Australian no: 02 4787 6020

International no: +61 (2) 47876020

Pay with:

Find us on