Understanding Coffee's Elliott Wave Analysis: A Strategic Guide for Traders
Coffee Elliott Wave Technical Analysis
Function: Counter-trend
Mode: Corrective
Structure: Triangle wave (X)
Position: Wave A of (Y)
Direction: Ongoing Wave A of (Y)
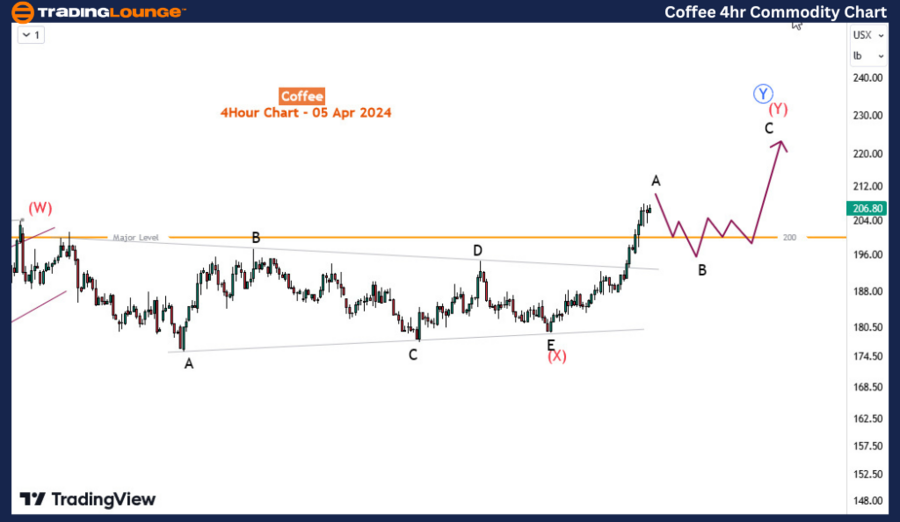
Insight: Wave A has surpassed the 200 mark, indicating the potential for further rise. The critical 200 level might serve as support for a Wave B retreat post-Wave A's climax. This analysis remains consistent with previous insights.
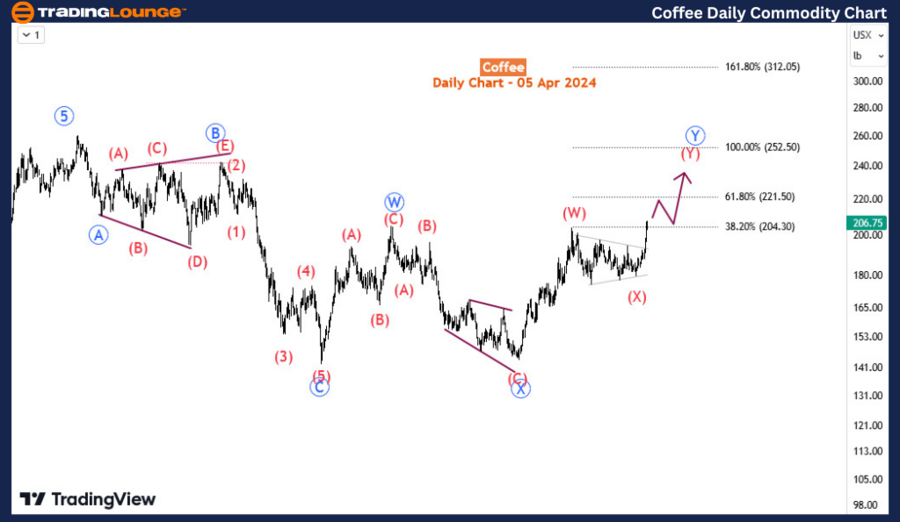
As we entered April 2024, Coffee witnessed a significant breakout from a three-month-long consolidation, marking its highest price point since October 2022. This development comes after a noteworthy 42% surge from its low in October 2023, showcasing a bullish momentum that suggests an optimistic short-term forecast for Coffee prices. Currently trading at $206, the market anticipates additional upward movements in the forthcoming weeks. This article delves into the Elliott wave analysis of Coffee, offering traders a roadmap to leverage this upward trend effectively.
Daily Timeframe Analysis: The rally from October 2023 signifies the third segment of a mid-term bullish correction that started in January 2023, shaping a double three (zigzag) pattern identified as wave W-X-Y (highlighted in blue). The recent upswing from October 2023 marks the commencement of wave Y, expected to progress through its third leg, tagged as wave (Y). The prior wave (X) is recognized by the contracting triangle pattern over the past three months. Thus, a minimum 3-wave rally for wave (Y) is projected, beginning with an upward swing, succeeded by a downward correction, and culminating in another ascent for the final leg. Adopting a 'buy the dip' approach is advised for capitalizing on this trend.

H4 Timeframe Insight: Within the wave (Y), a subdivision into waves A-B-C is observed. Wave A has transcended the pivotal 200 level, pending final confirmation of its completion. It's crucial to monitor the completion of wave A and the onset of wave B, particularly how the price interacts with the 200 level. The termination of wave B will set the stage for tracing wave C's ascent. The recommended trading strategy involves patience, awaiting wave B's resolution before positioning for the anticipated rise marked by wave C. By following this strategic approach, traders can navigate the Coffee market's bullish phase with precision, ensuring profitable engagements before the trend's reversal.
Key Takeaways:
- The Elliott Wave Analysis highlights a current bullish trend in Coffee prices, suggesting an opportune moment for traders.
- A strategic buy-the-dip method is recommended, focusing on the wave patterns within the H4 timeframe for precise entry points.
- Monitoring the critical 200 level as a potential support zone during the wave B correction phase is essential for timing trades effectively.
This guide aims to equip traders with a thorough understanding of the ongoing Elliott wave cycle in the Coffee market, enabling informed and strategic trading decisions to maximize returns before the bullish trend concludes.
Technical Analyst: Sanmi Adeagbo
Source: visit Tradinglounge.com and learn From the Experts Join TradingLounge Here
See Previous: Gold
TradingLounge Once Off SPECIAL DEAL: Here > 1 month Get 3 months.
TradingLounge's Free Week Extravaganza!
April 14 – 21: Unlock the Doors to Trading Excellence — Absolutely FREE
