23Jun

BHP Group Limited Elliott Wave Forecast Predicts Strong Bullish Wave 3 Rally for ASX BHP With Key Entry and Price Confirmation Levels

Greetings,
Our Elliott Wave forecast today centers on BHP GROUP LIMITED (ASX: BHP), traded on the Australian Stock Exchange (ASX). Current analysis suggests the third wave (Wave 3 – navy) may be gaining upward momentum. This technical update outlines the short-term Elliott Wave outlook, key bullish trend indicators, and potential entry points for traders, including a defined invalidation level.

ASX: BHP Elliott Wave Analysis - TradingLounge 1-Day Chart

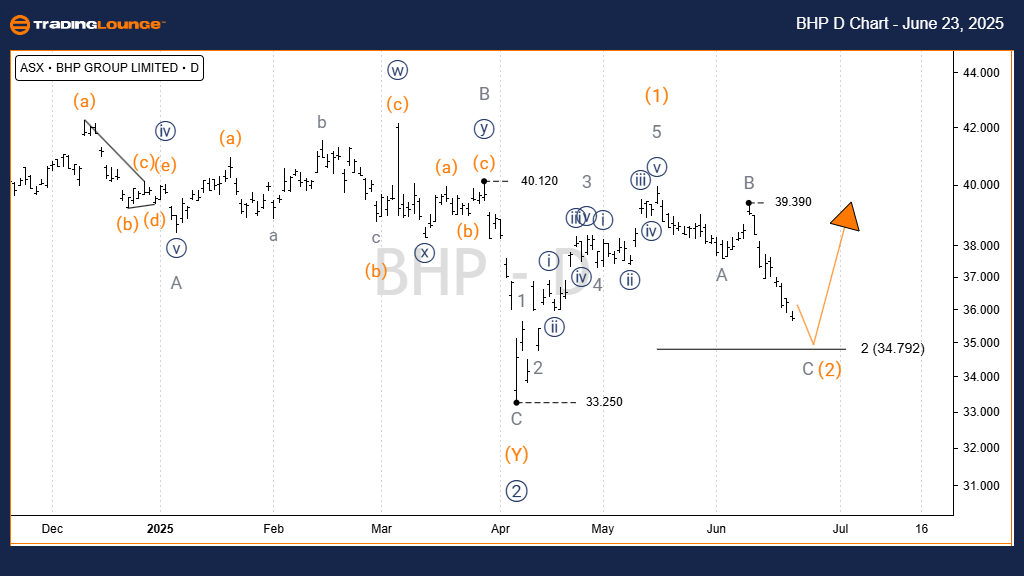
ASX: BHP GROUP LIMITED – BHP (1-Day Chart, Semilog Scale) Technical Analysis

ASX: BHP GROUP LIMITED – BHP Elliott Wave Technical Analysis

Function: Major trend (Intermediate degree, orange)

Mode: Motive

Structure: Impulse

Position: Wave 3) – orange

Details: Wave 2) – navy appears to have ended, with Wave 3) – navy potentially in progress. This larger wave subdivides into Wave 3) – orange, which could push toward the 40.00 price target. In the near term, we may observe a minor pullback to 34.792 (Wave 2) – orange), followed by a breakout above 39.390, confirming the Wave 3) – orange advance.

Invalidation Point: 33.25

Confirmation Point: 39.390

BHP-asx-d-chart-2306...


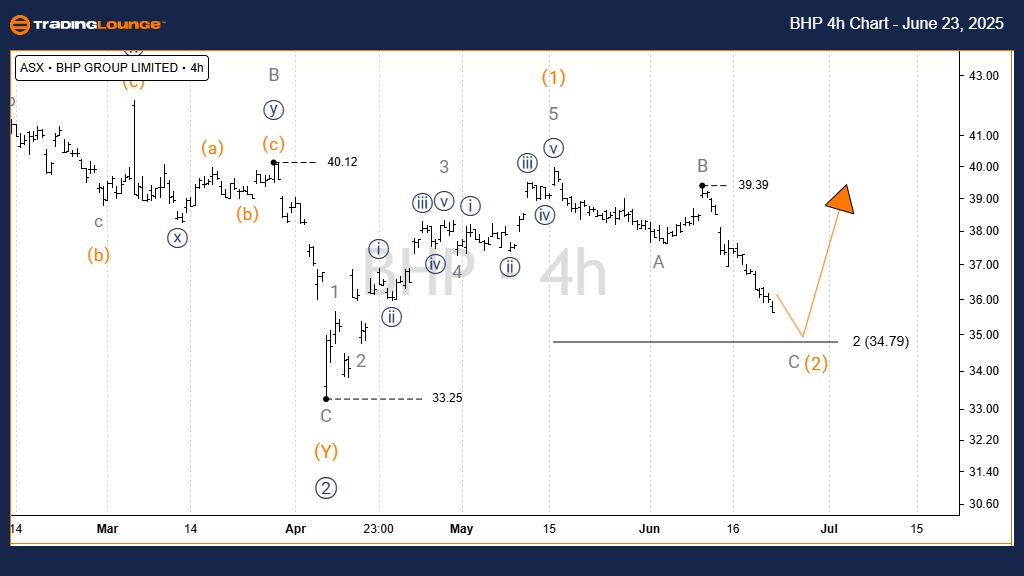
ASX: BHP GROUP LIMITED – BHP Elliott Wave Technical Analysis (4-Hour Chart)

Function: Major trend (Intermediate degree, orange)

Mode: Motive

Structure: Impulse

Position: Wave 3) – orange

Details: Wave 2) – orange is likely nearing completion, based on a full ABC corrective pattern (waves A, B, C – grey). Wave C – grey is closing in on a key support zone near 34.792. A reversal from this area followed by a break above 39.390 would validate the start of Wave 3) – orange.

Invalidation Point: 33.83 (original value adjusted from 84.83 due to likely error)

Confirmation Point: 39.390

Technical Analyst: Hua (Shane) Cuong, CEWA-M (Master’s Designation).

Source: Visit Tradinglounge.com and learn from the Experts. Join TradingLounge Here 

See Previous: NORTHERN STAR RESOURCES LTD Elliott Wave Technical Analysis

VALUE Offer - $1 for 2 Weeks then $29 a month!Click here

Access 7 Analysts Over 200 Markets Covered. Chat Room With Support

BHP-asx-4h-chart-230...


Conclusion:
This Elliott Wave analysis for ASX: BHP GROUP LIMITED (BHP) provides a strategic view of the short-term market structure, highlighting price zones that could trigger bullish continuation. Monitoring the confirmation and invalidation levels enhances confidence in our current wave count and supports informed trading decisions. Our aim is to deliver objective and data-driven market insights to help traders navigate the ASX effectively.

Related

Learn About the ASX WBC Share Price Forecasts, and Technical Chart Updates For Westpac Banking Corporation Elliott Wave Analysis

Learn About the ASX WBC Share Price Forecasts, and Technical Chart Updates For Westpac Banking Corporation Elliott Wave Analysis

Our detailed Elliott Wave analysis will give valuable insights into ASX: Westpac Banking Corporation...

Read More >
Achieving ASX Trading Success: SOUTH32 LIMITED Stock Insights & S32 Elliott Wave Technical Analysis

Achieving ASX Trading Success: SOUTH32 LIMITED Stock Insights & S32 Elliott Wave Technical Analysis

Our comprehensive Elliott Wave analysis for ASX: S32 (SOUTH32 LIMITED) highlights potential retracem...

Read More >
Develop Effective Trading Strategies and TRON's Crypto Price Movement with TRXUSD Elliott Wave Technical Analysis

Develop Effective Trading Strategies and TRON's Crypto Price Movement with TRXUSD Elliott Wave Technical Analysis

Gain valuable insights into TRXUSD with comprehensive Elliott Wave analysis, helping you predict TRO...

Read More >
Britannia Industries Elliott Wave Technical Analysis: Price Prediction, Support & Resistance Levels and Share Price Forecast

Britannia Industries Elliott Wave Technical Analysis: Price Prediction, Support & Resistance Levels and Share Price Forecast

Britannia Industries has undergone a significant five-wave impulse decline from its 6450 high. A cor...

Read More >
U.S.Dollar/Swiss Franc Analysis covers Forex chart forecasts: USDCHF Elliott Wave Technical Analysis

U.S.Dollar/Swiss Franc Analysis covers Forex chart forecasts: USDCHF Elliott Wave Technical Analysis

Get the latest USDCHF Elliott Wave analysis for accurate forex trading strategies. This analysis cov...

Read More >
Hang Seng Index Elliott Wave Technical Analysis: It covers the current trends and impulsive phases within the index's movement.

Hang Seng Index Elliott Wave Technical Analysis: It covers the current trends and impulsive phases within the index's movement.

This article provides a detailed Elliott Wave Analysis for the Hang Seng Index on both daily and wee...

Read More >

$1 for 2 Weeks

then $29 a month!

What a Special Offer!

Trade Recommendations

Unleash the power of deversified trading with our comprehensive portfolio, covering 250+ markets:

  • Stock Trades
  • Crypto Trades
  • Forex Trades
  • Commodity Trades
Elliott Wave Analysis

Gain a competitive edge with expert insights and AI-powered Elliott Wave charting into:

  • Global Indices
  • US Stocks & ASX Stocks
  • Forex & Crypto
  • Commodities
Top-Notch Trading Tools

Equip yourself with the tools of success:

  • Real-time Chat rooms
  • Elliott Wave Algorithm
  • Portfolio tools
  • TradingLevels
  • Screener
  • Trading Game
7 Elliott Wave Analysts

Stay ahead of the market with daily charts and insightful videos
Your secret to strategic trading!

JOIN HERE


Welcome to TradingLounge (ASIC A.R.No. 321187), specialists in trades, trading education and technical analysis, covering stocks, indices, commodities, forex and cryptocurrencies.

When you join TradingLounge you have access to everything we offer, including trade tools, educational content and a social platform to chat with like-minded investors.

Read more

@Copyright 2024 by tradinglounge.com

Contact Us

Australian no: 02 4787 6020

International no: +61 (2) 47876020

Pay with:

Find us on