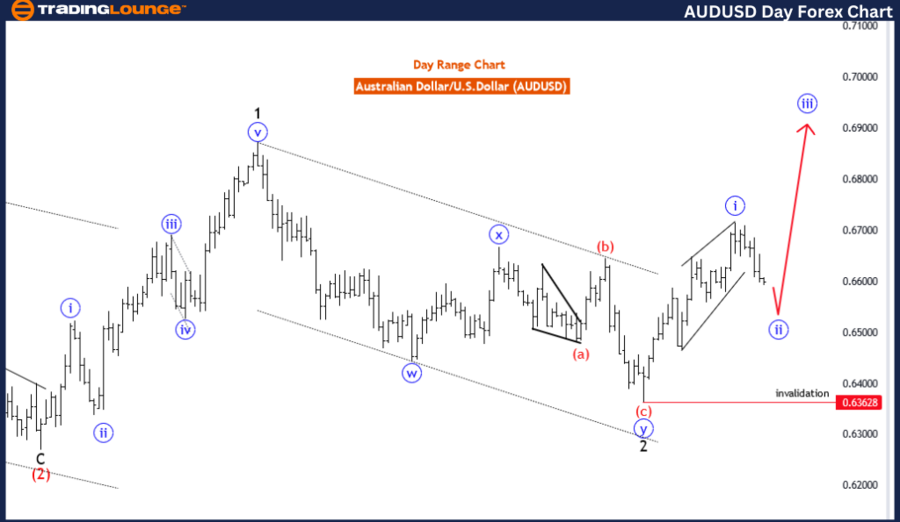
AUDUSD Elliott Wave Analysis Trading Lounge Day Chart
Australian Dollar/U.S. Dollar (AUDUSD) Day Chart Analysis
AUDUSD Elliott Wave Technical Analysis
Function: Trend
Mode: Corrective
Structure: Blue wave 2
Position: Black wave 3
Direction Next Higher Degrees: Blue wave 2
Details: Blue wave 1 appears completed at 0.67165. Currently, blue wave 2 of 3 is in progress.
Wave Cancel Invalid Level: 0.63628
The AUDUSD Elliott Wave analysis on the day chart uses Elliott Wave theory to understand the current trend and predict future movements. The market function is identified as a trend, indicating that the price movements are generally predictable and analyzable.
The market mode is corrective, suggesting an adjustment phase within the larger trend. Specifically, the structure under analysis is blue wave 2, part of a broader corrective pattern within the overall trend.
Currently, the market is positioned in black wave 3, indicating it is in the third wave of a larger five-wave sequence. This phase typically involves significant price shifts.
The analysis suggests a transition to blue wave 3 after completing the current corrective phase (blue wave 2). Following the correction, the market is expected to resume its primary trend with an impulsive wave, characterized by strong and decisive price movements.
The details highlight that blue wave 1 has completed at 0.67165, marking the end of the initial trend phase. Now, blue wave 2 of 3 is underway, indicating a market correction before resuming the primary trend direction with blue wave 3.
A critical aspect is the wave cancel invalid level at 0.63628. If the market price drops below this point, it invalidates the current wave count and necessitates reassessment of the wave structure and market projections. Monitoring this level is essential to confirm the wave pattern's validity and ensure accurate predictions.
In summary, the AUDUSD on the day chart is in a corrective phase within blue wave 2 of a larger trend. The market is expected to complete this correction before transitioning to blue wave 3, marking a return to the primary trend. The wave cancel invalid level is crucial for validating the current analysis and future forecasts.
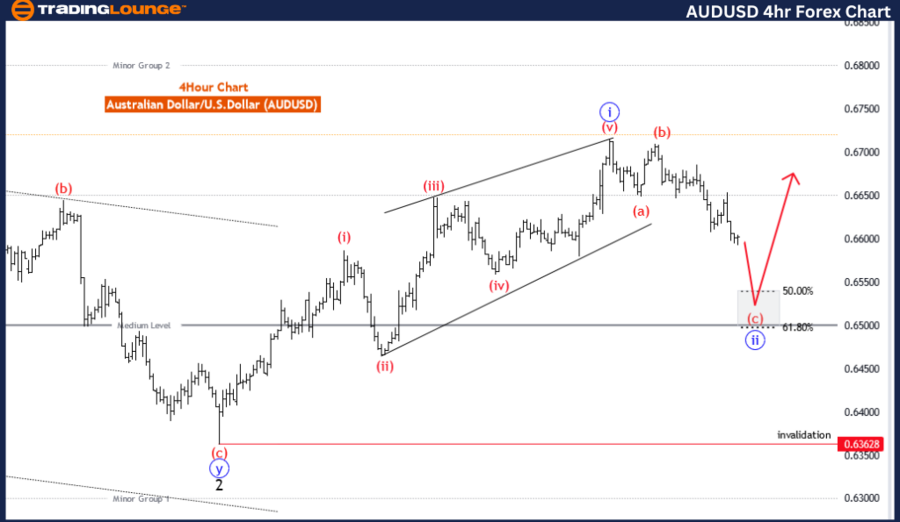
AUDUSD Elliott Wave Analysis Trading Lounge 4-Hour Chart
Australian Dollar/U.S. Dollar (AUDUSD) 4 Hour Chart
AUDUSD Elliott Wave Technical Analysis
Function: Counter Trend
Mode: Corrective
Structure: Red wave C
Position: Blue wave 2
Direction Next Higher Degrees: Blue wave 3
Details: Red wave B of 2 appears complete. Now, red wave C of 2 is in progress.
Wave Cancel Invalid Level: 0.63628
The AUDUSD Elliott Wave analysis on the 4-hour chart uses Elliott Wave theory to understand current market trends. The prevailing function is counter-trend, suggesting a movement against the primary trend, indicating a temporary correction or retracement phase.
The market mode is corrective, characterized by a structure designed to counter the preceding trend. Specifically, the structure under examination is red wave C, part of a larger corrective wave pattern. The market is currently positioned in blue wave 2, indicating an ongoing correction before potentially resuming the primary trend.
The analysis suggests that the direction in the next higher degrees will be blue wave 3. After completing the current corrective phase (blue wave 2), the market is expected to enter a new impulsive phase, characterized by stronger and more decisive price movements in the primary trend direction.
Details indicate that red wave B of blue wave 2 appears completed, and now red wave C of blue wave 2 is in progress. This phase involves completing corrective movements before resuming the primary trend direction. The completion of red wave C will mark the end of the corrective phase (blue wave 2), setting the stage for the next impulsive wave (blue wave 3).
A crucial aspect is the wave cancel invalid level at 0.63628. This level serves as a critical threshold; if the market price drops below this point, it invalidates the current wave count, necessitating reassessment of the wave structure and market direction. Monitoring this level is essential to confirm the wave pattern's validity and ensure accurate market predictions.
In summary, the AUDUSD is in a counter-trend on the 4-hour chart, undergoing a corrective phase within blue wave 2. The market is expected to complete red wave C before transitioning to blue wave 3, marking a return to the primary trend. Monitoring the invalidation level is crucial to validate the current wave count and ensure accurate future market forecasts.
Technical Analyst: Malik Awais
Source: visit Tradinglounge.com and learn From the Experts Join TradingLounge Here
Previous: Euro/U.S.Dollar(EURUSD) Elliott Wave Technical Analysis
Special Trial Offer - 0.76 Cents a Day for 3 Months! Click here
Access 7 Analysts Over 170 Markets Covered. Chat Room With Support