31Mar

ASX Trading: Insurance Australia Group (ASX:IAG) Stock Analysis and Elliott Wave Technical Forecast for Smarter Investing

ASX: INSURANCE AUSTRALIA GROUP LIMITED – IAG Elliott Wave Technical Analysis  

Hello,
Today's Elliott Wave forecast focuses on Insurance Australia Group Limited (ASX:IAG), analyzing the current corrective pattern and short-term price expectations within the Australian share market.

Our updated analysis identifies ASX:IAG as continuing within a corrective wave formation. We anticipate a modest decline before a potential recovery move, aligning with our broader technical perspective.


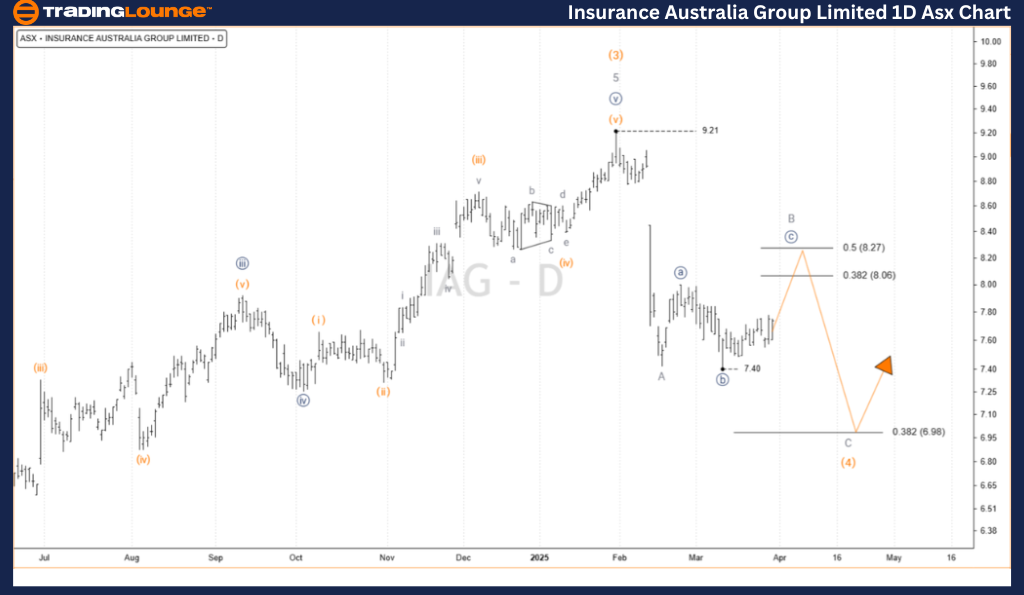
ASX: INSURANCE AUSTRALIA GROUP LIMITED – IAG Elliott Wave Technical Analysis 1D Chart (Semilog Scale) 

Trend Function: Major trend (Primary degree, navy)

Mode: Motive

Wave Structure: Impulse

Current Position: Wave B-grey of Wave (4)-orange

Details:

Wave (4)-orange is still unfolding lower after completing Wave (3)-orange. The movement could extend toward the 38.2% Fibonacci retracement level. Wave A-grey has already finished, with Wave B-grey showing slight upward momentum.

Invalidation Point: 7.40

INSURANCE-AUSTRALIA-...


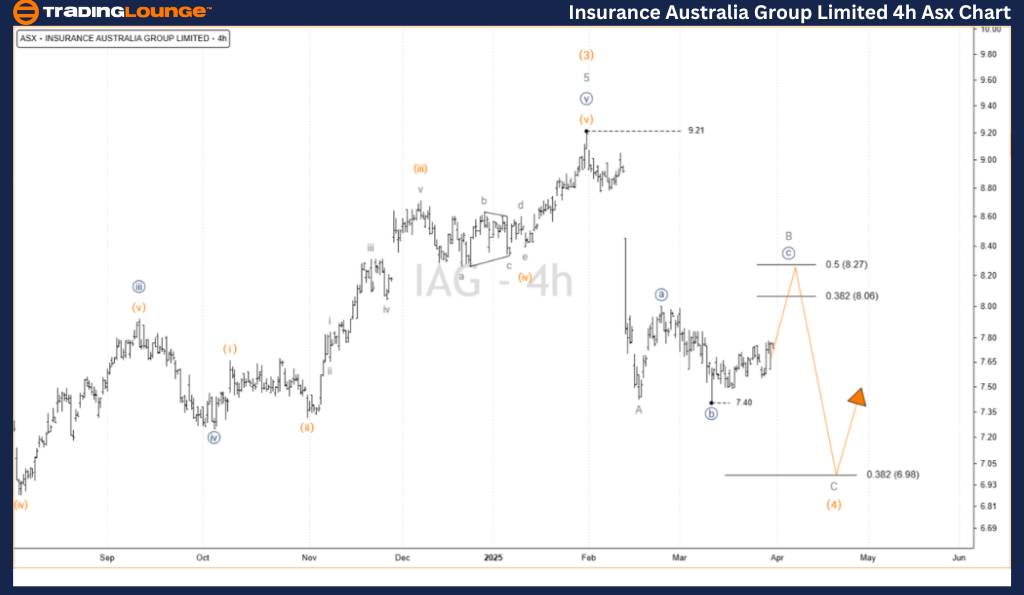
ASX: INSURANCE AUSTRALIA GROUP LIMITED – IAG Elliott Wave Technical Analysis | TradingLounge (4-Hour Chart)

Trend Function: Major trend (Intermediate degree, orange)

Mode: Motive

Wave Structure: Impulse

Current Position: Wave ((c))-navy of Wave B-grey

Details:

Wave B-grey appears to be developing as a Flat correction, labeled ((a))((b))((c))-navy. With ((B))-navy complete, Wave ((c))-navy is now advancing, targeting the price region between 8.063 and 8.271. A drop below 7.400 would invalidate this count and suggest the beginning of Wave C-grey.

Invalidation Point: 7.40

Technical Analyst: Hua (Shane) Cuong, CEWA-M (Master’s Designation).

Source: Visit Tradinglounge.com and learn from the Experts. Join TradingLounge Here 

See Previous: NEWS CORPORATION – NWS Elliott Wave Technical Analysis

VALUE Offer - Buy 1 Month & Get 3 Months!Click here

Access 7 Analysts Over 200 Markets Covered. Chat Room With Support

INSURANCE-AUSTRALIA-...


Conclusion:

This technical breakdown of ASX: INSURANCE AUSTRALIA GROUP LIMITED – IAG provides insights into the ongoing wave count and potential price movements. The analysis includes key validation and invalidation levels to support trading decisions. We aim to offer a concise, data-driven outlook aligned with Elliott Wave principles for ASX traders and investors.

Related

British Pound/Japanese Yen(GBPJPY) Elliott Wave Technical Analysis 6 November 23

British Pound/Japanese Yen(GBPJPY) Elliott Wave Technical Analysis 6 November 23

In conclusion, the GBP/JPY Elliott Wave Analysis on the 4-hour chart, dated 6 November 23, paints a ...

Read More >
Fortinet Inc.(FTNT:NYSE) Elliott Wave Technical Analysis 15 December 23

Fortinet Inc.(FTNT:NYSE) Elliott Wave Technical Analysis 15 December 23

Fortinet Inc.(FTNT: NYSE) Elliott Wave Technical Analysis dated 15 December 23, FTNT Stock Market An...

Read More >
Enhance your investment outcomes in National Australia Bank Limited - NAB Elliott Wave Technical Forecast

Enhance your investment outcomes in National Australia Bank Limited - NAB Elliott Wave Technical Forecast

Discover comprehensive Elliott Wave analysis for ASX: NATIONAL AUSTRALIA BANK LIMITED (NAB). Our in-...

Read More >
Understanding the Current Retracement Phase and the Upcoming Bullish Trend - Swiss Market Index Elliott Wave Technical Analysis

Understanding the Current Retracement Phase and the Upcoming Bullish Trend - Swiss Market Index Elliott Wave Technical Analysis

This article provides an in-depth Elliott Wave analysis of the Swiss Market Index, focusing on both ...

Read More >
Shanghai Composite Elliott Wave Analysis: Bullish Wave 3 in Progress Across Daily and Weekly Charts for Trading Insight

Shanghai Composite Elliott Wave Analysis: Bullish Wave 3 in Progress Across Daily and Weekly Charts for Trading Insight

Elliott Wave analysis of the Shanghai Composite identifies a bullish Wave 3 pattern in both daily an...

Read More >
Forex Analysis Emphasizes Crucial Levels to Watch U.S. Dollar/Japanese Yen (USDJPY) Elliott Wave Technical Analysis

Forex Analysis Emphasizes Crucial Levels to Watch U.S. Dollar/Japanese Yen (USDJPY) Elliott Wave Technical Analysis

This article provides a detailed USDJPY Elliott Wave analysis, covering both daily and 4-hour charts...

Read More >

$1 for 2 Weeks

then $29 a month!

What a Special Offer!

Trade Recommendations

Unleash the power of deversified trading with our comprehensive portfolio, covering 250+ markets:

  • Stock Trades
  • Crypto Trades
  • Forex Trades
  • Commodity Trades
Elliott Wave Analysis

Gain a competitive edge with expert insights and AI-powered Elliott Wave charting into:

  • Global Indices
  • US Stocks & ASX Stocks
  • Forex & Crypto
  • Commodities
Top-Notch Trading Tools

Equip yourself with the tools of success:

  • Real-time Chat rooms
  • Elliott Wave Algorithm
  • Portfolio tools
  • TradingLevels
  • Screener
  • Trading Game
7 Elliott Wave Analysts

Stay ahead of the market with daily charts and insightful videos
Your secret to strategic trading!

JOIN HERE


Welcome to TradingLounge (ASIC A.R.No. 321187), specialists in trades, trading education and technical analysis, covering stocks, indices, commodities, forex and cryptocurrencies.

When you join TradingLounge you have access to everything we offer, including trade tools, educational content and a social platform to chat with like-minded investors.

Read more

@Copyright 2024 by tradinglounge.com

Contact Us

Australian no: 02 4787 6020

International no: +61 (2) 47876020

Pay with:

Find us on