JNJ Elliott Wave Analysis
This Elliott Wave analysis of Johnson & Johnson (NYSE: JNJ) covers both the daily and 1-hour timeframes, highlighting current market structure and forecasting future price action based on Elliott Wave Theory.
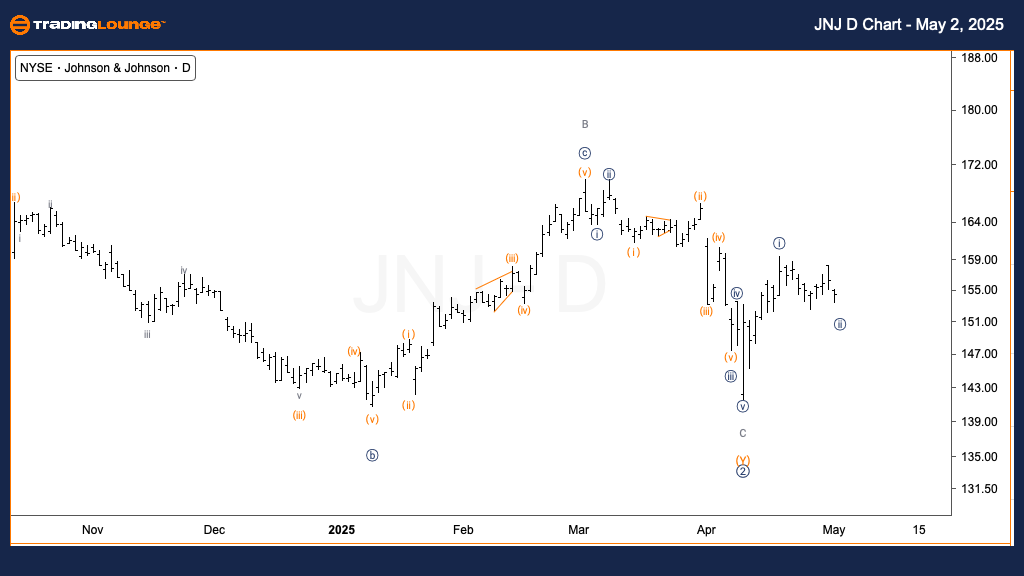
Johnson & Johnson (JNJ) Elliott Wave Analysis | Trading Lounge Daily Chart
JNJ Elliott Wave Technical Analysis
FUNCTION: Trend
MODE: Impulsive
STRUCTURE: Motive
POSITION: Wave {i} of 1
DIRECTION: Upside in Wave 1
Details: Johnson & Johnson (JNJ) appears to be forming a significant bottom within Primary Wave 2. A visible five-wave impulsive rally into Wave {i} signals the early development of a new uptrend, suggesting the resumption of bullish momentum.
Daily Chart Outlook: We are closely observing the final stages of a major corrective Primary Wave 2. The confirmed five-wave sequence into Wave {i} indicates a potential trend reversal and the emergence of a strong bullish cycle for JNJ stock.
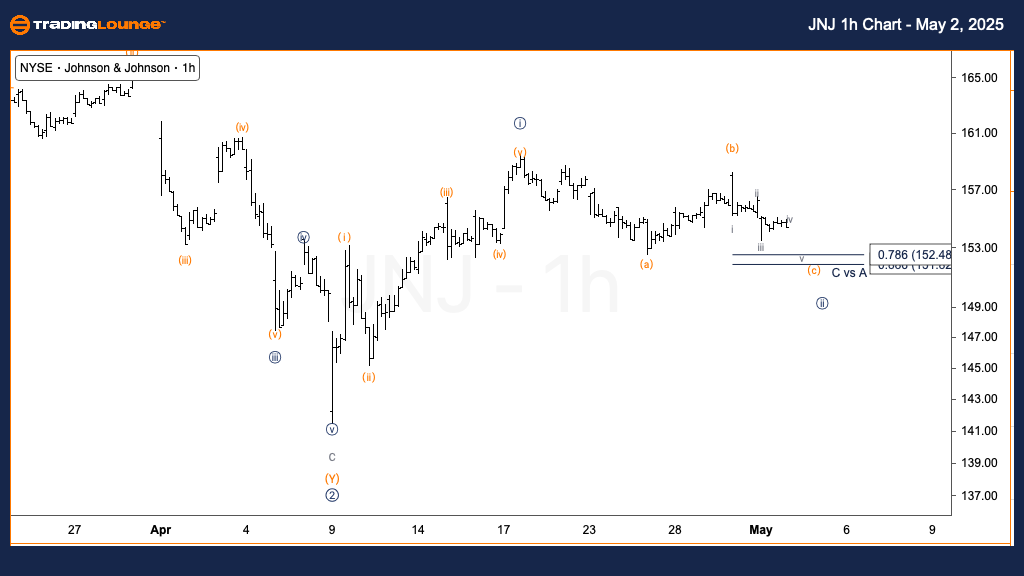
Johnson & Johnson (JNJ) Elliott Wave Analysis - TradingLounge 1h Chart
JNJ Elliott Wave Technical Analysis
FUNCTION: Trend
MODE: Impulsive
STRUCTURE: Motive
POSITION: Wave (c) of {ii}
DIRECTION: Bottom in Wave (c)
Details: A minor decline is expected to complete Wave (c) of {ii}, after which Johnson & Johnson (JNJ) could pivot higher. This move upward could mark the start of Minute Wave {iii} if the Primary Wave 2 bottom is confirmed, or it could evolve into a corrective rally within a broader structure.
1-Hour Chart Outlook: On the intraday chart, the Wave {ii} correction is nearing completion, with Wave (c) requiring a final minor low. A confirmed reversal here would strengthen the bullish outlook and likely initiate the next leg higher into Wave {iii} for JNJ stock.
Technical Analyst: Alessio Barretta
Source: Visit Tradinglounge.com and learn from the Experts. Join TradingLounge Here
Previous: QCOM Elliott Wave Technical Analysis
VALUE Offer - Buy 1 Month & Get 3 Months!Click here
Access 7 Analysts Over 200 Markets Covered. Chat Room With Support