01May

QCOM Elliott Wave Analysis: Qualcomm Stock Forecast, Bullish Trading Setup, and Investment Outlook Using Daily and 1H Charts

QCOM Elliott Wave Analysis | Trading Lounge Daily Chart

QUALCOMM Inc. (QCOM) Daily Chart Analysis

QCOM Elliott Wave Technical Analysis

Function: Trend

Mode: Impulsive

Structure: Motive

Position: Wave {i} of 1

Direction: Upside in Wave 1

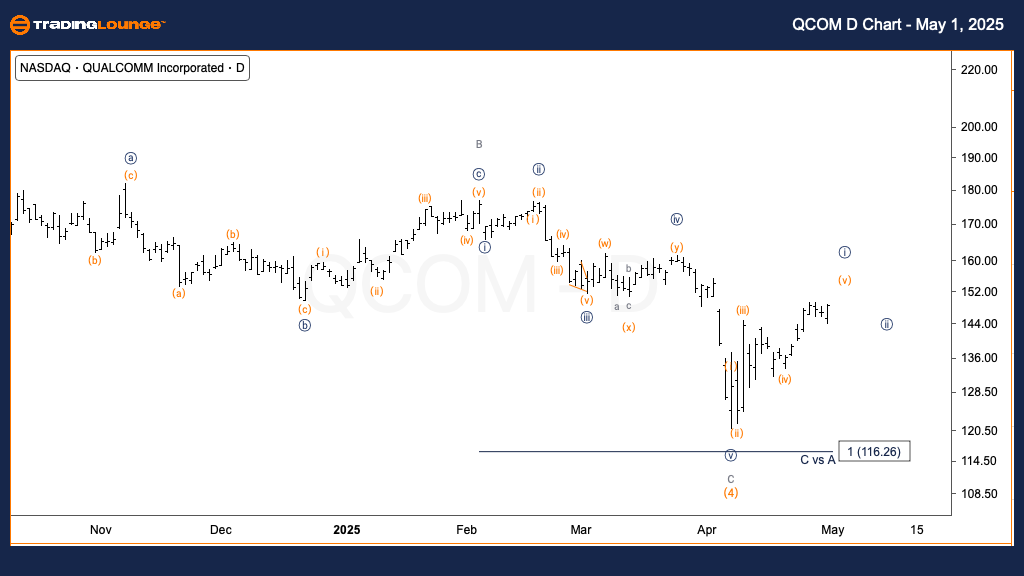
Details: QUALCOMM Inc. (QCOM) has confirmed a bottom in Intermediate Wave (4), supported by a clear five-wave count in Wave C, narrowly missing Wave A's level. Focus is now on identifying the top of Wave {i} and preparing for the corrective pullback in Wave {ii}, aiming to position for the next upside opportunity.

QCOM Elliott Wave Technical Analysis – Daily Chart
QUALCOMM's (QCOM) daily Elliott Wave analysis shows completion of Intermediate Wave (4) with a detailed five-wave C structure. Although it missed Wave A equality by a few dollars, momentum has shifted upward into Wave {i}. We are anticipating a short-term high soon and will be looking closely at the corrective move in Wave {ii} for potential new long trading setups.

QCOM-US-stock-day-ch...


QUALCOMM Inc. (QCOM) Elliott Wave Analysis - TradingLounge 1h Chart

QCOM Elliott Wave Technical Analysis

Function: Trend

Mode: Impulsive

Structure: Motive

Position: Wave (v) of {i}

Direction: Upside in Wave (v)

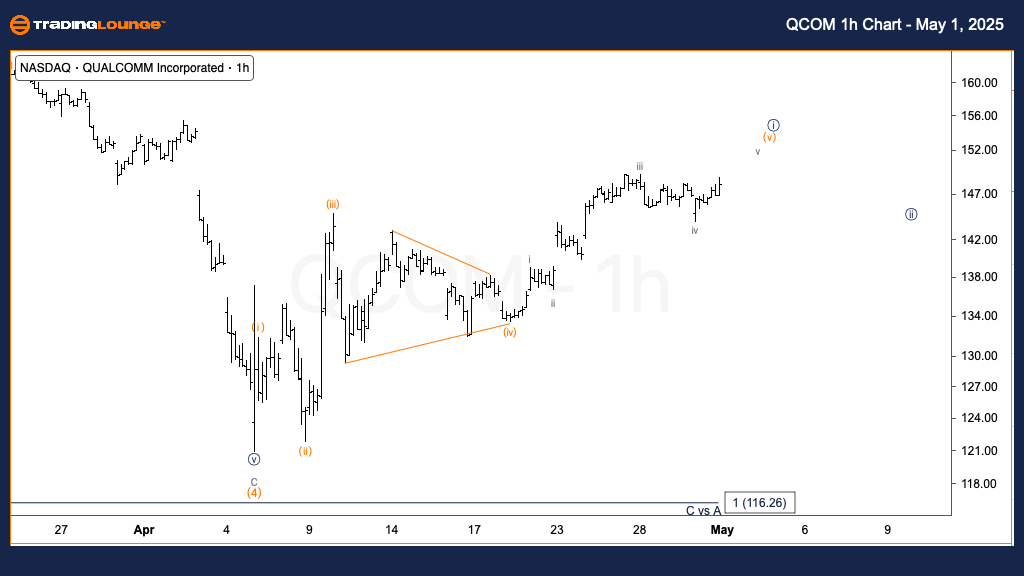
Details: In the 1-hour Elliott Wave count, QUALCOMM (QCOM) is pushing through Wave (v) of {i}. We expect one last move higher, targeting resistance near the key Medium Level of $150, which could mark a significant pivot point.

QCOM Elliott Wave Technical Analysis – 1h Chart

QUALCOMM Inc. (QCOM) on the 1-hour timeframe is advancing within Wave (v) of {i}, with a final thrust higher expected. Watch the $150 Medium Level for resistance and possible signs of trend reversal or consolidation as the wave structure matures.

Technical Analyst: Alessio Barretta

Source: Visit Tradinglounge.com and learn from the Experts. Join TradingLounge Here 

Previous: MicroStrategy Inc Elliott Wave Technical Analysis

VALUE Offer - Buy 1 Month & Get 3 Months!Click here

Access 7 Analysts Over 200 Markets Covered. Chat Room With Support

QCOM-US-stock-1H-cha...


Summary

This QCOM Elliott Wave analysis provides a detailed view of QUALCOMM Inc.’s (QCOM) bullish trend using both daily and 1-hour charts. The focus remains on tracking the impulsive wave progression and identifying new trading opportunities during the upcoming corrective phases.

Related

Caterpillar (CAT) Elliott Wave Analysis: Bullish Stock Forecast with Technical Chart Insights, and Trading Strategy Guide

Caterpillar (CAT) Elliott Wave Analysis: Bullish Stock Forecast with Technical Chart Insights, and Trading Strategy Guide

This analysis provides a comprehensive Elliott Wave breakdown of Caterpillar Inc. (CAT), highlightin...

Read More >
TSLA Stock Forecast: Tesla Elliott Wave Technical Analysis & Key Price Levels

TSLA Stock Forecast: Tesla Elliott Wave Technical Analysis & Key Price Levels

This comprehensive Elliott Wave analysis of Tesla Inc. (TSLA) provides an in-depth look at both dail...

Read More >
Cocoa Elliott Wave Analysis: Price Forecast, Fibonacci Support, and Bullish Wave 3 Setup for 2024 Trading Strategy

Cocoa Elliott Wave Analysis: Price Forecast, Fibonacci Support, and Bullish Wave 3 Setup for 2024 Trading Strategy

Cocoa is currently pulling back from its all-time high, but the bullish Elliott Wave structure remai...

Read More >
U.S. Dollar / Swiss Franc (USDCHF) Elliott Wave Technical Analysis: Market Outlook & Trading Strategy for Forex Traders

U.S. Dollar / Swiss Franc (USDCHF) Elliott Wave Technical Analysis: Market Outlook & Trading Strategy for Forex Traders

USDCHF Elliott Wave analysis, covering the daily and 4-hour charts, explains the corrective wave str...

Read More >
ASX Vanguard Australian Shares (VAS) ETF Elliott Wave Technical Update: Wave 3-Grey Unfolding with Key Price Targets

ASX Vanguard Australian Shares (VAS) ETF Elliott Wave Technical Update: Wave 3-Grey Unfolding with Key Price Targets

This article provides a detailed Elliott Wave analysis for ASX VAS ETF, focusing on wave 3-grey'...

Read More >
Amazon Stock Elliott Wave Analysis: AMZN Forecast Shows Corrective Zigzag Pattern with $159 Price Target and Potential Reversal Ahead

Amazon Stock Elliott Wave Analysis: AMZN Forecast Shows Corrective Zigzag Pattern with $159 Price Target and Potential Reversal Ahead

Elliott Wave analysis of Amazon (AMZN) stock using daily and hourly charts. It identifies a correcti...

Read More >

$1 for 2 Weeks

then $29 a month!

What a Special Offer!

Trade Recommendations

Unleash the power of deversified trading with our comprehensive portfolio, covering 250+ markets:

  • Stock Trades
  • Crypto Trades
  • Forex Trades
  • Commodity Trades
Elliott Wave Analysis

Gain a competitive edge with expert insights and AI-powered Elliott Wave charting into:

  • Global Indices
  • US Stocks & ASX Stocks
  • Forex & Crypto
  • Commodities
Top-Notch Trading Tools

Equip yourself with the tools of success:

  • Real-time Chat rooms
  • Elliott Wave Algorithm
  • Portfolio tools
  • TradingLevels
  • Screener
  • Trading Game
7 Elliott Wave Analysts

Stay ahead of the market with daily charts and insightful videos
Your secret to strategic trading!

JOIN HERE


Welcome to TradingLounge (ASIC A.R.No. 321187), specialists in trades, trading education and technical analysis, covering stocks, indices, commodities, forex and cryptocurrencies.

When you join TradingLounge you have access to everything we offer, including trade tools, educational content and a social platform to chat with like-minded investors.

Read more

@Copyright 2024 by tradinglounge.com

Contact Us

Australian no: 02 4787 6020

International no: +61 (2) 47876020

Pay with:

Find us on