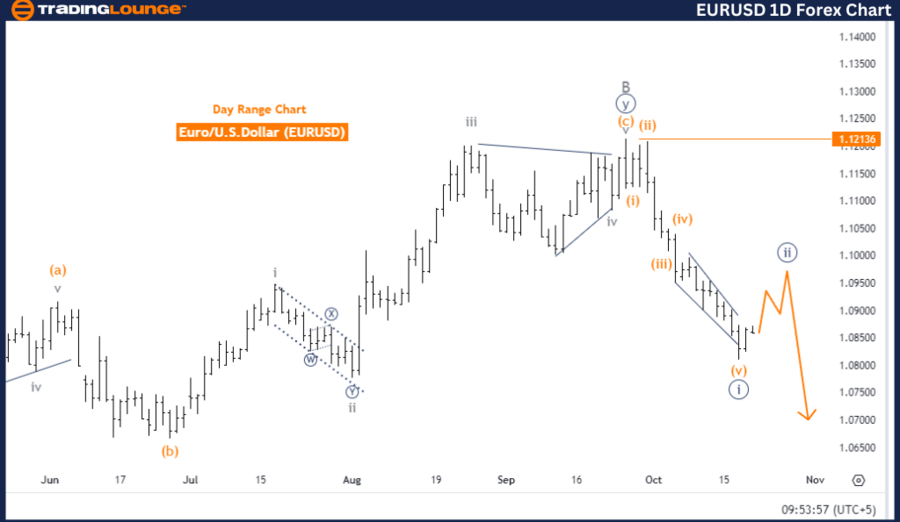
EURUSD Elliott Wave Analysis – Trading Lounge Day Chart

Euro / U.S. Dollar (EURUSD) – Day Chart

EURUSD Elliott Wave Technical Analysis

Function: Counter Trend

Mode: Corrective

Structure: Navy Blue Wave 2

Position: Gray Wave C

Direction Next Lower Degrees: Navy Blue Wave 3

Details: Navy Blue Wave 1 appears completed, and Navy Blue Wave 2 is currently developing.

Wave Cancel Invalid Level: 1.12136

The EURUSD Elliott Wave analysis on the daily chart indicates that the market is in a corrective phase. Currently, Navy Blue Wave 2 is unfolding after the completion of Navy Blue Wave 1. This corrective phase represents a counter-trend movement, suggesting a temporary pullback or consolidation before the main trend resumes.

At this stage, the market is positioned within Gray Wave C, a part of the corrective structure. The ongoing correction is expected to continue until Navy Blue Wave 2 completes. Once this correction concludes, Navy Blue Wave 3 is likely to begin, which could signal a stronger impulsive move. The direction of this impulsive move, whether upwards or downwards, will depend on how the market reacts at that point.

A key level to watch is 1.12136, the wave cancellation point. If the price dips below this level, the current Elliott Wave count will be invalid, requiring a reassessment of the wave structure.

Summary

  • Current Phase: Corrective phase within Navy Blue Wave 2, positioned in Gray Wave C.
  • Next Move: After the completion of Wave 2, Navy Blue Wave 3 is anticipated to begin.
  • Invalidation Level: 1.12136—if breached, the current wave structure is no longer valid.

EURUSD-1D-Forex-Char...


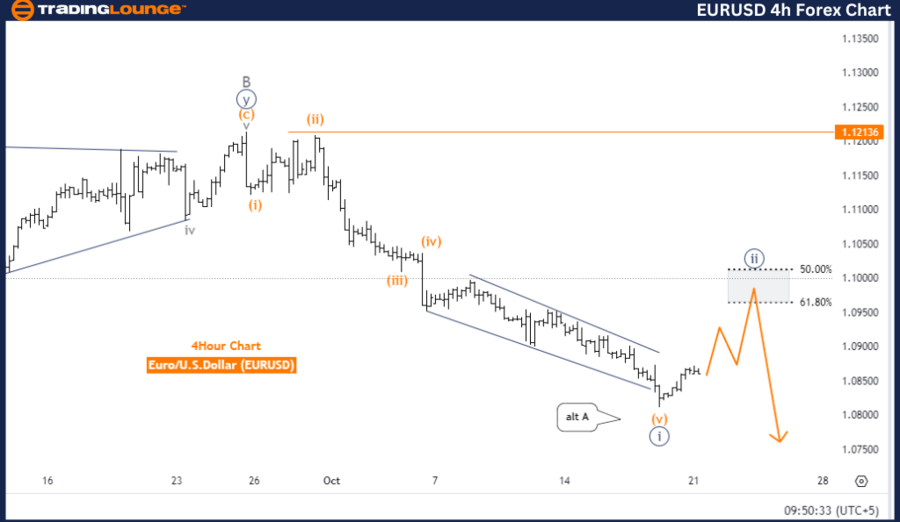
Euro / U.S. Dollar (EURUSD) – 4-Hour Chart

EURUSD Elliott Wave Technical Analysis

Function: Counter Trend

Mode: Corrective

Structure: Navy Blue Wave 2

Position: Gray Wave C

Direction Next Lower Degrees: Navy Blue Wave 3

Details: Navy Blue Wave 1 has concluded, and Navy Blue Wave 2 is now in progress.

Wave Cancel Invalid Level: 1.12136

The EURUSD 4-hour chart also reflects a counter-trend correction. Following the completion of Navy Blue Wave 1, the market is now within Navy Blue Wave 2. Similar to the daily chart analysis, the market is currently positioned within Gray Wave C, part of the broader corrective phase.

This phase suggests a temporary pullback or consolidation, typically before the main trend resumes. Once Navy Blue Wave 2 completes, Navy Blue Wave 3 is expected to emerge, possibly marking a new impulsive move in either direction, depending on how the market evolves.

For traders, the critical level to monitor is 1.12136, which serves as the wave cancellation point. If the price drops below this level, the current wave structure will become invalid, and the wave count will need to be reassessed.

Summary

  • Current Phase: The market is in Navy Blue Wave 2, positioned in Gray Wave C.
  • Next Move: Navy Blue Wave 3 is expected after Wave 2 ends.
  • Invalidation Level: 1.12136—if breached, the current wave structure will be invalid.

Technical Analyst: Malik Awais

Source: visit Tradinglounge.com and learn From the Experts Join TradingLounge Here 

Previous:U.S. Dollar / Canadian Dollar (USDCAD) Elliott Wave Technical Analysis

VALUE Offer - Buy 1 Month & Get 3 Months!Click here

Access 7 Analysts Over 200 Markets Covered. Chat Room With Support

EURUSD-4h-Forex-Char...

Related

Elliott Wave Analysis for NASDAQ 100 & Tech Stocks: Insights & Strategies for NDX, SP500, and Major Companies

Elliott Wave Analysis for NASDAQ 100 & Tech Stocks: Insights & Strategies for NDX, SP500, and Major Companies

This summary provides a comprehensive Elliott Wave analysis of the NASDAQ 100 (NDX) and major techno...

Read More >
Palo Alto Networks (PANW) Elliott Wave Technical  Analysis: Key Stock Predictions & Future Trends

Palo Alto Networks (PANW) Elliott Wave Technical Analysis: Key Stock Predictions & Future Trends

This article provides an in-depth Elliott Wave analysis of Palo Alto Networks (PANW) stock. Covering...

Read More >
British Pound/U.S.Dollar (GBPUSD) Elliott Wave Technical Analysis 19 October 23

British Pound/U.S.Dollar (GBPUSD) Elliott Wave Technical Analysis 19 October 23

In summary, the GBPUSD Elliott Wave Analysis for 19 October 23, delivers valuable insights into the ...

Read More >
EUR/USD Elliott Wave Analysis Reveals Bullish Impulse Pattern Suggesting Continued Uptrend in Forex Market

EUR/USD Elliott Wave Analysis Reveals Bullish Impulse Pattern Suggesting Continued Uptrend in Forex Market

The EUR/USD pair exhibits a bullish impulsive pattern according to Elliott Wave analysis, indicating...

Read More >
Investing in Stocks, ETFs, or index funds: S&P 500 Index Elliott Wave Technical Analysis for Bullish and Bearish Markets

Investing in Stocks, ETFs, or index funds: S&P 500 Index Elliott Wave Technical Analysis for Bullish and Bearish Markets

Explore in-depth S&P 500 Elliott Wave analysis with a focus on trading strategies and investment tip...

Read More >
UNIBAIL RODAMCO WESTFIELD Stock Analysis & URW Elliott Wave Technical Forecast Make Informed Decisions

UNIBAIL RODAMCO WESTFIELD Stock Analysis & URW Elliott Wave Technical Forecast Make Informed Decisions

Our detailed Elliott Wave analysis of ASX: UNIBAIL-RODAMCO-WESTFIELD (URW) provides insights into cu...

Read More >

$1 for 2 Weeks

then $29 a month!

What a Special Offer!

Trade Recommendations

Unleash the power of deversified trading with our comprehensive portfolio, covering 250+ markets:

  • Stock Trades
  • Crypto Trades
  • Forex Trades
  • Commodity Trades
Elliott Wave Analysis

Gain a competitive edge with expert insights and AI-powered Elliott Wave charting into:

  • Global Indices
  • US Stocks & ASX Stocks
  • Forex & Crypto
  • Commodities
Top-Notch Trading Tools

Equip yourself with the tools of success:

  • Real-time Chat rooms
  • Elliott Wave Algorithm
  • Portfolio tools
  • TradingLevels
  • Screener
  • Trading Game
7 Elliott Wave Analysts

Stay ahead of the market with daily charts and insightful videos
Your secret to strategic trading!

JOIN HERE


Welcome to TradingLounge (ASIC A.R.No. 321187), specialists in trades, trading education and technical analysis, covering stocks, indices, commodities, forex and cryptocurrencies.

When you join TradingLounge you have access to everything we offer, including trade tools, educational content and a social platform to chat with like-minded investors.

Read more

@Copyright 2024 by tradinglounge.com

Contact Us

Australian no: 02 4787 6020

International no: +61 (2) 47876020

Pay with:

Find us on