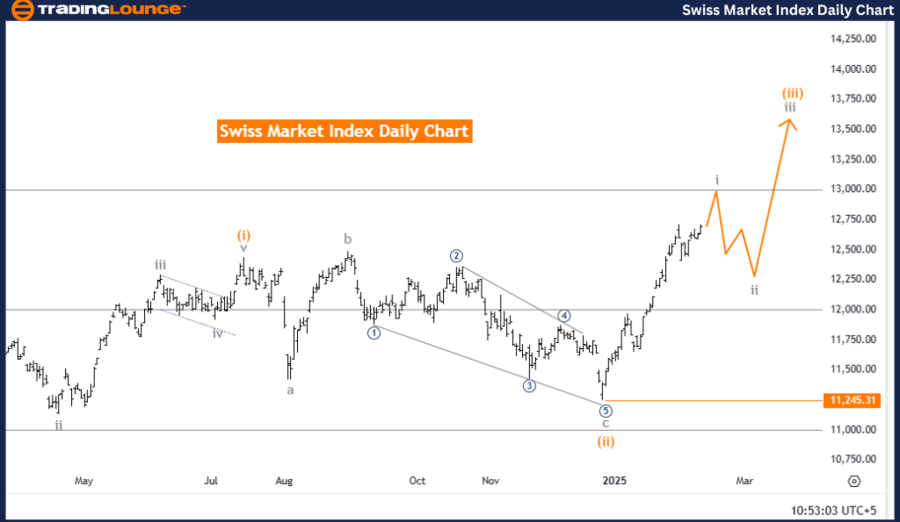
Swiss Market Index – Elliott Wave Analysis (Day Chart)
Swiss Market Index Elliott Wave Technical Analysis
Technical Overview
Function: Bullish Trend
Mode: Impulsive
Structure: Gray Wave 1
Position: Orange Wave 3
Next Lower-Degree Wave: Gray Wave 2
Details: Orange Wave 2 has completed, and Gray Wave 1 of 3 is now in progress.
Wave Cancel Invalidation Level: 11,245.31
Market Analysis
The Swiss Market Index (SMI) day chart maintains a bullish trend with a well-defined impulsive wave structure. The active wave, Gray Wave 1, is a crucial phase within a broader upward movement. Following the completion of Orange Wave 2, the market has transitioned from a corrective phase into a new bullish wave.
With Gray Wave 1 of 3 now unfolding, this marks the beginning of an impulsive trend, typically characterized by strong price acceleration. This phase signifies renewed bullish momentum, indicating a potential rise in price levels as the uptrend gains traction.
Key Considerations
✅ Gray Wave 2 is the next anticipated corrective phase after the current impulsive wave progresses.
✅ The bullish trend remains valid as long as the market stays above the invalidation level of 11,245.31.
✅ The wave structure suggests that the market is continuing its upward trajectory, with Gray Wave 1 leading the movement.
Conclusion
The Swiss Market Index (SMI) day chart confirms a bullish Elliott Wave structure, reinforcing positive market momentum. The completion of Orange Wave 2 has paved the way for Gray Wave 1 of 3, signaling a strong price move upward.
🔹 Traders should closely monitor price action to confirm sustained bullish momentum.
🔹 The 11,245.31 invalidation level serves as a critical threshold, ensuring that the uptrend remains intact
 .
.
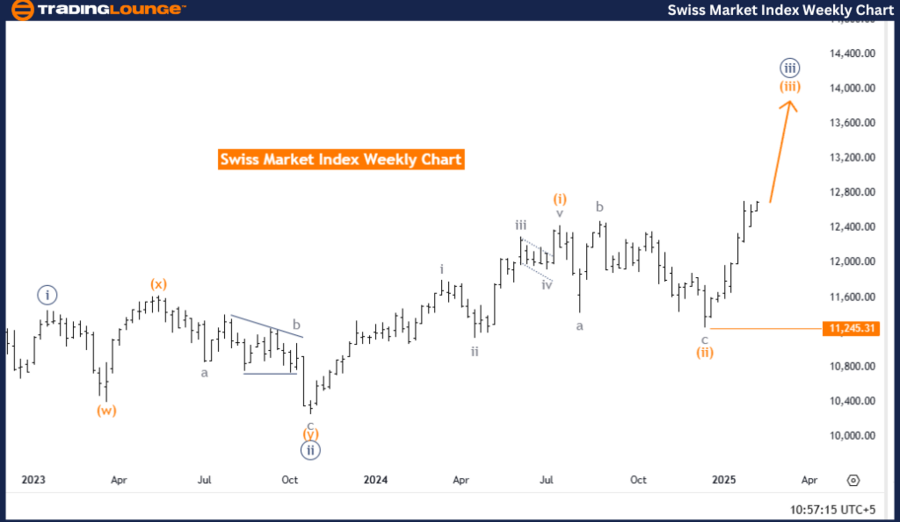
Swiss Market Index – Elliott Wave Analysis (Weekly Chart)
Swiss Market Index Elliott Wave Technical Analysis
Technical Overview
Function: Bullish Trend
Mode: Impulsive
Structure: Orange Wave 3
Position: Navy Blue Wave 3
Next Lower-Degree Wave: Orange Wave 4
Details: Orange Wave 2 completed, and Orange Wave 3 is currently active.
Wave Cancel Invalidation Level: 11,245.31
Market Analysis
The Swiss Market Index (SMI) weekly chart continues to exhibit a strong bullish trend, supported by an impulsive wave structure. The current active wave, Orange Wave 3, is part of a broader Navy Blue Wave 3, reinforcing the market’s strong upward trajectory.
With the completion of Orange Wave 2, the market has concluded its corrective phase, allowing Orange Wave 3 to take over. This transition typically marks a high-momentum phase, driving strong price acceleration. The ongoing bullish trend suggests a continued upward market outlook, as Orange Wave 3 fuels price growth.
Key Considerations
✅ The next lower-degree wave to watch is Orange Wave 4, expected to act as the next corrective phase once Orange Wave 3 completes.
✅ The bullish market structure remains intact as long as the market holds above the invalidation level of 11,245.31.
✅ The Elliott Wave formation supports a strong uptrend, with Orange Wave 3 serving as a catalyst for price increases.
Conclusion
The Swiss Market Index (SMI) weekly chart confirms an impulsive bullish wave structure, strengthening positive market sentiment. With Orange Wave 2 complete, the market is now in Orange Wave 3, indicating a strong bullish phase.
🔹 Traders should track price action closely to verify the continuation of bullish momentum.
🔹 The key invalidation level of 11,245.31 remains a vital support level, ensuring the uptrend remains intact.
Technical Analyst: Malik Awais
Source: visit Tradinglounge.com and learn From the Experts Join TradingLounge Here
Previous: KOSPI Composite Elliott Wave Technical Analysis
VALUE Offer - Buy 1 Month & Get 3 Months!Click here
Access 7 Analysts Over 200 Markets Covered. Chat Room With Support