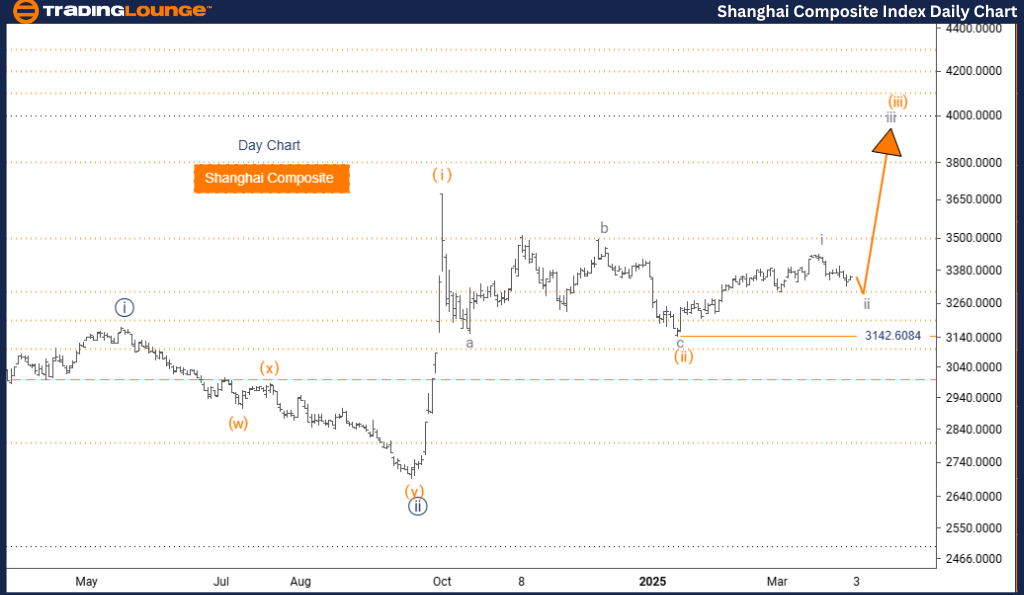
Shanghai Composite Elliott Wave Analysis – TradingLounge Daily Chart
Shanghai Composite Elliott Wave Technical Overview
Function: Counter Trend
Mode: Corrective
Structure: Gray Wave 2
Current Position: Orange Wave 3
Next Higher Degree Direction: Gray Wave 3
Invalidation Level: 3142.6084
Analysis Summary
According to the daily Elliott Wave analysis, the Shanghai Composite Index is currently in a corrective phase labeled as gray wave 2. This follows the end of gray wave 1, which displayed impulsive movement, and is part of a broader orange wave 3 formation.
This wave structure reflects a temporary counter-trend correction, implying a pause before an upward continuation as gray wave 3 develops. If the index dips below 3142.6084, this would invalidate the existing wave outlook.
Technical Details and Interpretation
- The completed gray wave 1 has set the stage for the gray wave 2 correction, which could form as a typical three-wave structure or sideways market activity.
- After this corrective move, the expected gray wave 3 would resume the overall bullish trend in the Shanghai Composite Index.
- This chart offers clarity on the current market correction while positioning it within the larger Elliott Wave cycle.
- Closely tracking the structure of gray wave 2 is important. It could signal trading opportunities, both for short-term strategies during the pullback and long-term investments as upward momentum builds again.
Conclusion
This Elliott Wave analysis provides a clearer view of short-term market corrections and longer-term upward potential in the Shanghai Composite. Traders who focus on wave relationships and key confirmation signals will be better equipped to respond to trend shifts.
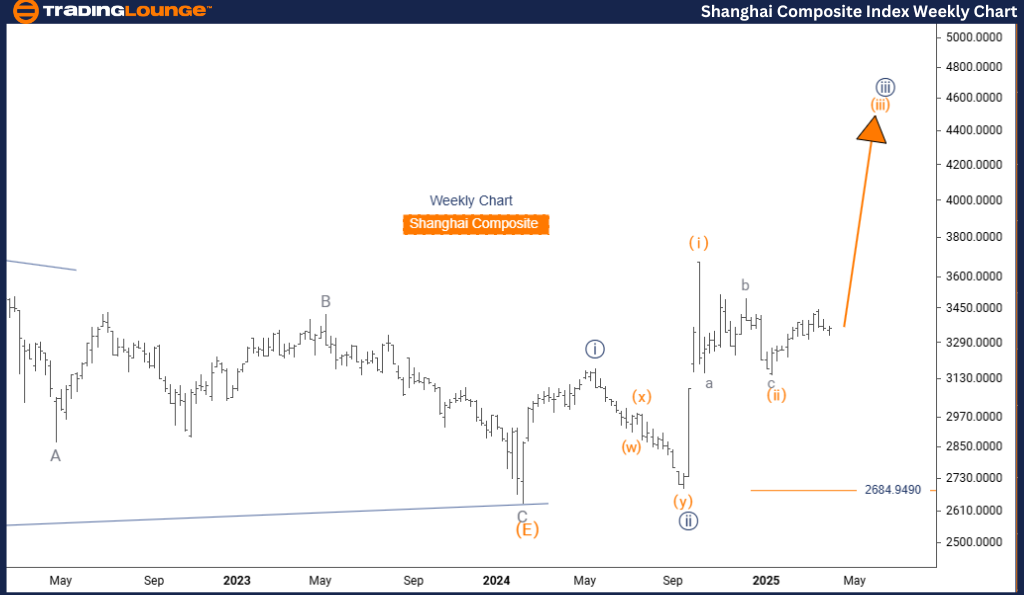
Shanghai Composite – TradingLounge Elliott Wave Technical Analysis | Weekly Chart
Shanghai Composite Elliott Wave Technical Overview
Function: Bullish Trend
Mode: Impulsive
Structure: Orange Wave 3
Current Position: Navy Blue Wave 3
Next Higher Degree Direction: Orange Wave 3 (Active)
Invalidation Level: 2684.9490
Analysis Summary
On the weekly chart, the Elliott Wave analysis of the Shanghai Composite Index reveals a strong bullish trend. The market is progressing through orange wave 3, situated within the larger navy blue wave 3 structure.
After finishing orange wave 2, the index now advances through orange wave 3—typically one of the most powerful upward phases in Elliott Wave analysis. This stage generally includes strong momentum and notable price gains.
Technical Insights
The invalidation level for this bullish structure is 2684.9490. If the index falls below this, the current bullish projection would be reconsidered.
The current structure supports a larger uptrend, offering useful insights for investors focused on long-term market participation in the Chinese equity market.
As orange wave 3 unfolds, it is expected to exhibit the following characteristics:
- Increased trading volume
- Accelerated price movement
- Sustained upward trend
This makes orange wave 3 a potential opportunity for medium-term and long-term gains.
Conclusion
The weekly Elliott Wave analysis supports ongoing bullish momentum in the Shanghai Composite Index, as long as price levels stay above 2684.9490. For position traders, this offers directional confidence and a potential window to benefit from the continuing market uptrend.
Nonetheless, using proper risk controls and watching wave development and critical levels will help strengthen both trading and investing decisions based on this analysis.
Technical Analyst: Malik Awais
Source: visit Tradinglounge.com and learn From the Experts Join TradingLounge Here
Previous: NASDAQ Elliott Wave Technical Analysis
VALUE Offer - Buy 1 Month & Get 3 Months!Click here
Access 7 Analysts Over 200 Markets Covered. Chat Room With Support