13Dec

The Coca-Cola Company (KO:NYSE) Elliott Wave Technical Analysis 13 December 23

The Coca-Cola Company, Elliott Wave Technical Analysis

The Coca-Cola Company, (KO:NYSE): 4h Chart 13 December 23

KO Stock Market Analysis: We are looking for further upside into wave 1 as we seem to be unfolding into a five wave move. At this point we could be getting close to a top as we are reaching 60$, with upside potential up to 65$.

KO Elliott Wave Count: Wave {v} of 1.  

KO Technical Indicators: Above all averages.

KO Trading Strategy: Looking for longs into wave {v}.

TradingLounge Analyst: Alessio Barretta

Source: Tradinglounge.com get trial here!

KO-4Hr-Stock-Chart-1...


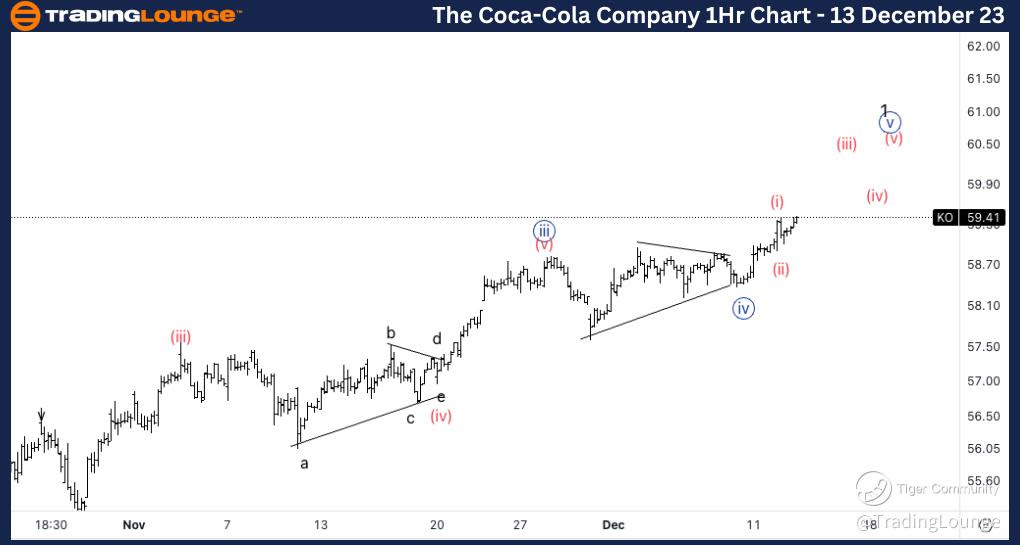
The Coca-Cola Company, KO: 1-hour Chart 13 December 23

The Coca-Cola Company, Elliott Wave Technical Analysis 

KO Stock Market Analysis: As you can see from this lower timeframe count we could have completed wave (ii) of {v} as we are resuming higher into wave (iii) of {v} from which we could expect acceleration higher.  

KO Elliott Wave count:  Wave (iii) of {v}

KO Technical Indicators: Above all averages.

KO Trading Strategy: Looking for longs within wave {v}.

KO-1Hr-Stock-Chart-1...

Related

AUDUSD Elliott Wave Analysis: In-Depth Insights on 4-Hour and Day Charts - February 6, 2024

AUDUSD Elliott Wave Analysis: In-Depth Insights on 4-Hour and Day Charts - February 6, 2024

This detailed analysis delves into the AUDUSD currency pair's Elliott Wave patterns, examining b...

Read More >
AAVE / U.S. dollar(AAVEUSD) Elliott Wave Technical Analysis 22 November 23

AAVE / U.S. dollar(AAVEUSD) Elliott Wave Technical Analysis 22 November 23

AAVE / U.S. dollar(AAVEUSD) Elliott Wave Analysis TradingLounge Daily Chart and 4H Chart dated 22 No...

Read More >
META's Stock Movements: Meta Platforms Inc. (META) Stocks Elliott Wave Technical Analysis

META's Stock Movements: Meta Platforms Inc. (META) Stocks Elliott Wave Technical Analysis

This article provides a detailed Elliott Wave analysis of Meta Platforms Inc. (META). It covers META...

Read More >
Polkadot Elliott Wave Technical Forecast: DOT Crypto Price Set for Reversal as Wave 2 Nears Completion with Strong Wave 3 Ahead

Polkadot Elliott Wave Technical Forecast: DOT Crypto Price Set for Reversal as Wave 2 Nears Completion with Strong Wave 3 Ahead

Polkadot (DOT) is in a wave 2 correction phase, with potential bullish reversal near $3.62–$3.94. E...

Read More >
Unlocking Elliott Wave Technical Analysis of Gold Commodity: A Comprehensive Guide to Price Trends and Investment Strategies

Unlocking Elliott Wave Technical Analysis of Gold Commodity: A Comprehensive Guide to Price Trends and Investment Strategies

This article offers an in-depth look at the gold commodity market, providing readers with a detailed...

Read More >

$1 for 2 Weeks

then $29 a month!

What a Special Offer!

Trade Recommendations

Unleash the power of deversified trading with our comprehensive portfolio, covering 250+ markets:

  • Stock Trades
  • Crypto Trades
  • Forex Trades
  • Commodity Trades
Elliott Wave Analysis

Gain a competitive edge with expert insights and AI-powered Elliott Wave charting into:

  • Global Indices
  • US Stocks & ASX Stocks
  • Forex & Crypto
  • Commodities
Top-Notch Trading Tools

Equip yourself with the tools of success:

  • Real-time Chat rooms
  • Elliott Wave Algorithm
  • Portfolio tools
  • TradingLevels
  • Screener
  • Trading Game
7 Elliott Wave Analysts

Stay ahead of the market with daily charts and insightful videos
Your secret to strategic trading!

JOIN HERE


Welcome to TradingLounge (ASIC A.R.No. 321187), specialists in trades, trading education and technical analysis, covering stocks, indices, commodities, forex and cryptocurrencies.

When you join TradingLounge you have access to everything we offer, including trade tools, educational content and a social platform to chat with like-minded investors.

Read more

@Copyright 2024 by tradinglounge.com

Contact Us

Australian no: 02 4787 6020

International no: +61 (2) 47876020

Pay with:

Find us on